GBPUSD learn how to trade GBPUSD
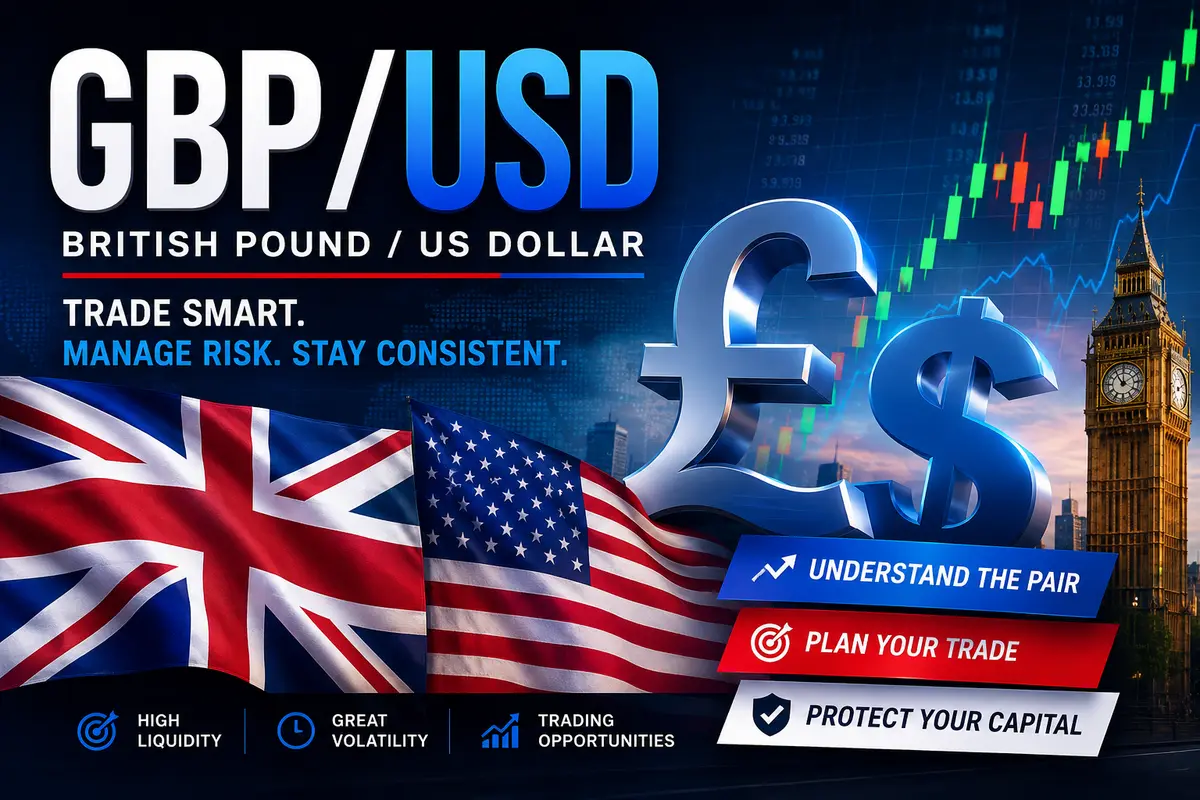
GBP/USD: The Currency Pair That Has Humbled Many Traders
There was a day I opened my chart and saw GBP/USD had already moved over 100 pips before noon. My first reaction was, "This market is too sweet. Imagine if I caught this move."
Then I asked myself another question.
"If I had entered at the wrong point, would I still be saying the same thing?"
That was when I started respecting this currency pair.
If you spend time around Nigerian forex traders, you will notice something. The moment GBP/USD starts moving, everybody suddenly becomes an analyst. One person says it is buying. Another says selling is the only option. Someone else posts a screenshot claiming they already caught the move from the beginning.
As a beginner, all those opinions can confuse you.
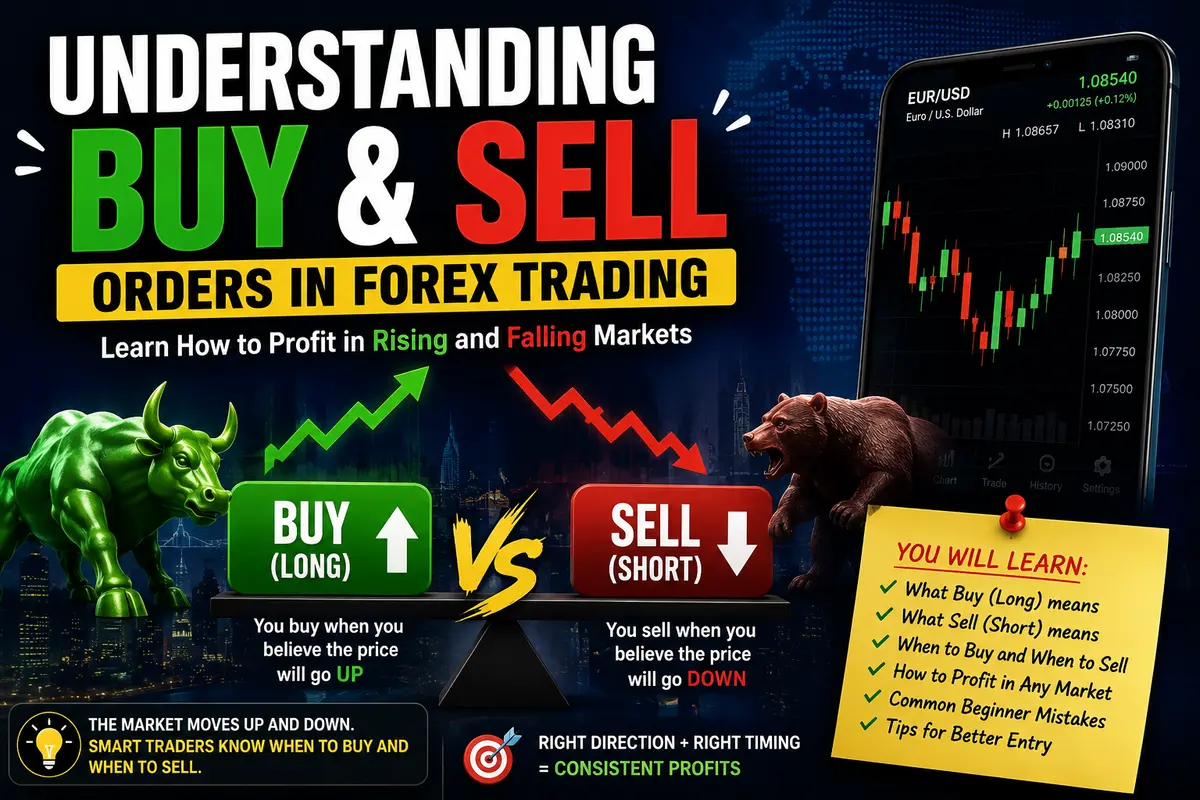
The truth is, GBP/USD does not care what anybody thinks. It will move according to what the market wants to do.
GBP/USD simply compares the British Pound with the US Dollar. If the price is climbing, it means the Pound is becoming stronger than the Dollar. If the chart is falling, then the Dollar is gaining strength.
Simple enough.
But trading it is a different story.
One mistake I see many people make is falling in love with fast-moving candles.
A long green candle appears, and before they even ask why the market is moving, they have already clicked the Buy button.
Sometimes it works.
Many times, it doesn't.
The market has a funny way of teaching expensive lessons to impatient traders.
Have you noticed how a trade always looks obvious after it has already happened?
When you look back at the chart, everything seems clear. You tell yourself, "I would have entered here and closed there."
But when the candles are still forming in real time, things...