

The Downtrend (Bearish Trend)

If you look at a chart and see a sequence of two or more consecutively falling price highs, you are looking at a market in a downtrend. In the trading world, this is universally known as a bearish trend.
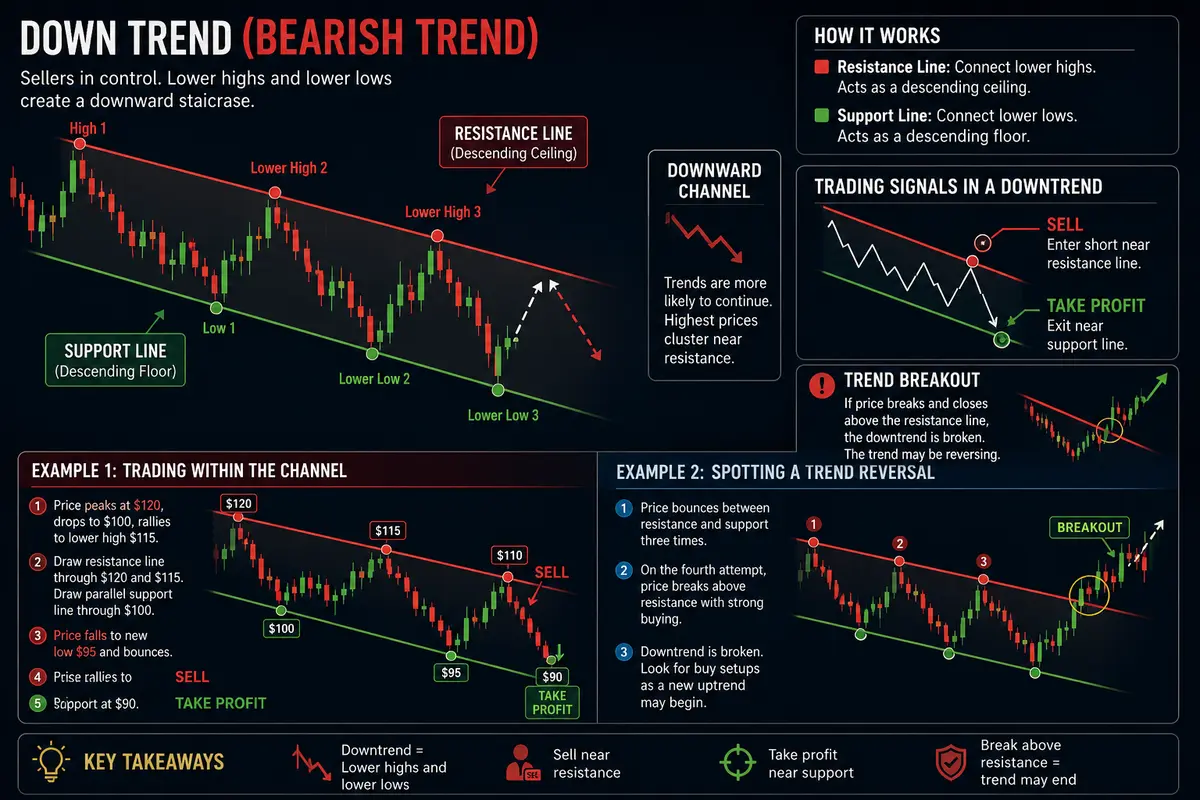
A downtrend tells a clear story about market psychology: sellers are firmly in control. Every time the price attempts to rally, sellers step in aggressively at lower and lower price points, cutting the recovery short. This continuous pressure creates a downward-staircase structure composed of lower highs and lower lows.
Mapping the Channel: Resistance and Support
To build a reliable forecast and generate accurate trading signals, we must draw structural lines across these turning points.
Because a downtrend is defined by its declining peaks, your primary tool is the
Resistance Line. You create this by drawing a straight line connecting the consecutive lower highs. This line acts as a descending ceiling, capping any temporary upward movements.
To complete the structural picture, we draw a second line perfectly parallel to the resistance line, running across the price troughs (the lower lows). This becomes your Support Line, acting as a descending floor.
By combining these two parallel lines, you map out a descending price channel. This framework is incredibly powerful for predicting future price behavior.
According to the foundational laws of market physics, an active trend is far more likely to continue its path than to suddenly reverse. This means that as long as the channel holds, lower prices are statistically favored, and the highest available premium prices will consistently cluster right along the upper Resistance Line.
Generating Trading Signals in a Bearish Market
Operating within a descending channel allows you to manage risk effectively while trading in harmony with the market’s momentum.
In a bearish market environment, your primary goal is to look for short-selling opportunities. The descending channel structure shows you exactly where to act:
-
The Entry (Sell): When the price experiences a temporary counter-trend rally and hits the upper Resistance Line, you open a Sell (short) position. This allows you to enter at the highest possible price within the current trend cycle.
-
The Exit (Take Profit): As the market drops back down, the lower Support Line acts as the natural barrier stopping the decline. This gives you the ideal target to buy back your position, close the trade, and secure your profits.
The Golden Rule for Downtrends: Sell near the upper Resistance Line, close your position near the lower Support Line, and continuously monitor the resistance ceiling to ensure the trend remains intact.
Market Breakouts: When Does the Downtrend End?
Just like an uptrend, a bearish trend will eventually run out of steam. The very first structural sign that a downtrend is ending occurs when the price decisively breaks and closes above the Resistance Line.
If the price pushes past this descending ceiling and manages to hold its ground, the bearish market structure is officially broken. This tells you that buyers have finally overwhelmed the sellers, and the downtrend has ceased to exist. However, if the price merely spikes above the line momentarily before dropping back inside the channel, it is considered a false breakout, and the active downtrend remains valid.
Step-by-Step Trading Examples
Let’s look at two practical examples to see how this strategy plays out in real market conditions.
Example 1: Trading Within the Channel
Imagine you are analyzing an asset that has entered a clear downward cycle.
-
The asset peaks at $120, drops to $100, and then rallies back up to a lower peak of $115.
-
You connect the $120 and $115 peaks to establish your descending Resistance Line. You then clone this line and place it parallel against the $100 trough to complete your channel.
-
The price drops again, hitting a new lower low at $95 right on your parallel support floor, and then bounces back up.
-
As the price climbs back up to touch the Resistance Line at $110, you execute a Sell order.
-
The trend continues downward, and when the price approaches the lower support boundary at $90, you hit your Take Profit target and exit the trade with a clean gain.
Example 2: Spotting a Trend Reversal
Let’s say you are monitoring a currency pair inside a tight descending channel. The price has bounced between the resistance ceiling and support floor three times successfully.
On the fourth approach toward the Resistance Line, instead of bouncing downward, a massive wave of buying volume enters the market. The price surges straight through the descending ceiling and closes the daily session well above the line.
This is your cue to immediately halt all short-selling plans. The downtrend is dead. You can now look for a structural shift to buy the asset, expecting a new uptrend to form.
Common Mistakes to Avoid When Charting a Downtrend
Precision is vital when drawing your trendlines. Sloppy charting lines lead to false signals and costly mistakes.
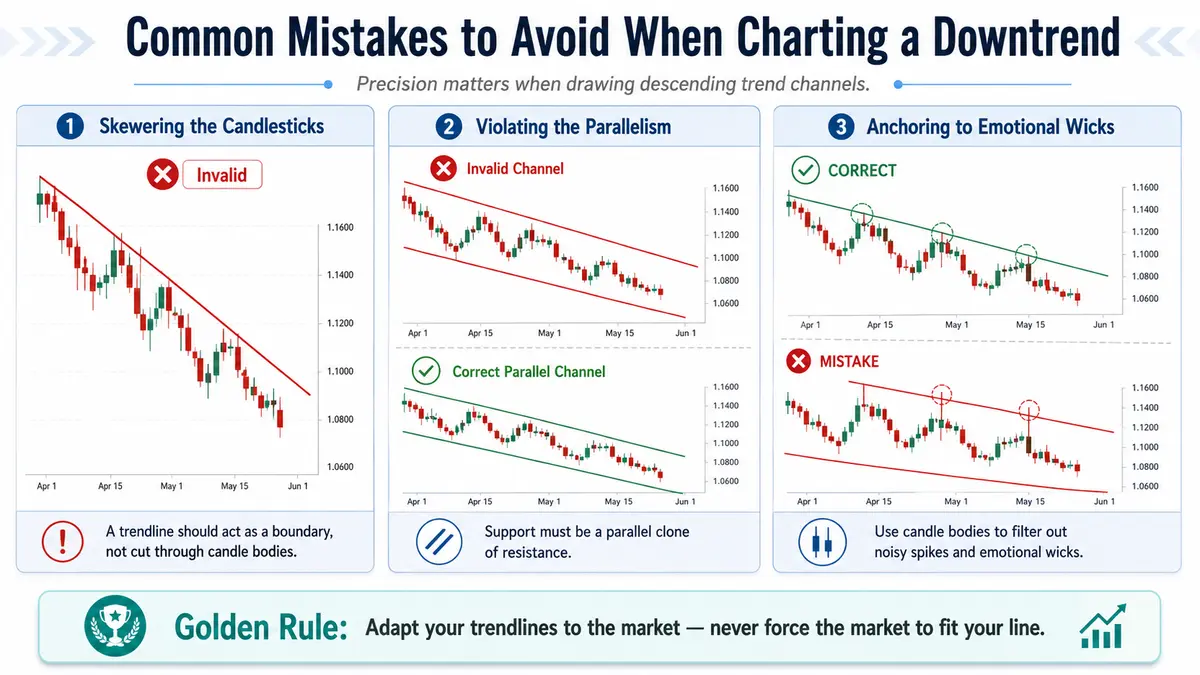
1. Skewering the Candlesticks
A trendline must strictly run along the outer perimeter of the price action. A common, fatal mistake is drawing a line that cuts directly through the center of candlestick bodies or chops through a cluster of data points just to force a connection between two distant peaks. If your line behaves like a skewer passing through the middle of the chart, it is completely invalid.
2. Violating the Parallelism
A true descending channel relies entirely on geometry. Your Support Line must be an exact, parallel clone of your Resistance Line. Beginners often make the mistake of drawing two completely independent lines with different angles. This ruins your ability to accurately calculate your Take Profit targets and completely misrepresents the market structure.
3. Anchoring to Emotional Wicks
Just as we establish in bullish trends, your lines must be anchored correctly to be sustainable.
-
The Correct Approach: Your trendline should pass cleanly along the edges of the candlestick real bodies, gently grazing them without slicing through them.
-
The Mistake: It is an error to anchor your lines to the very tips of long, volatile candlestick shadows (wicks) or to position the line floating completely above or below the actual candles.
Focusing your anchors on the edges of the candle bodies filters out irrational, short-term market noise (like brief spikes triggered by a news headline) and gives you a much truer, highly reliable picture of where the actual market consensus lies.

Comments
No comments yet. Be the first to share your thoughts!
Authentication Required
You must be logged in to post a comment.