

The Uptrend (Bullish Trend)
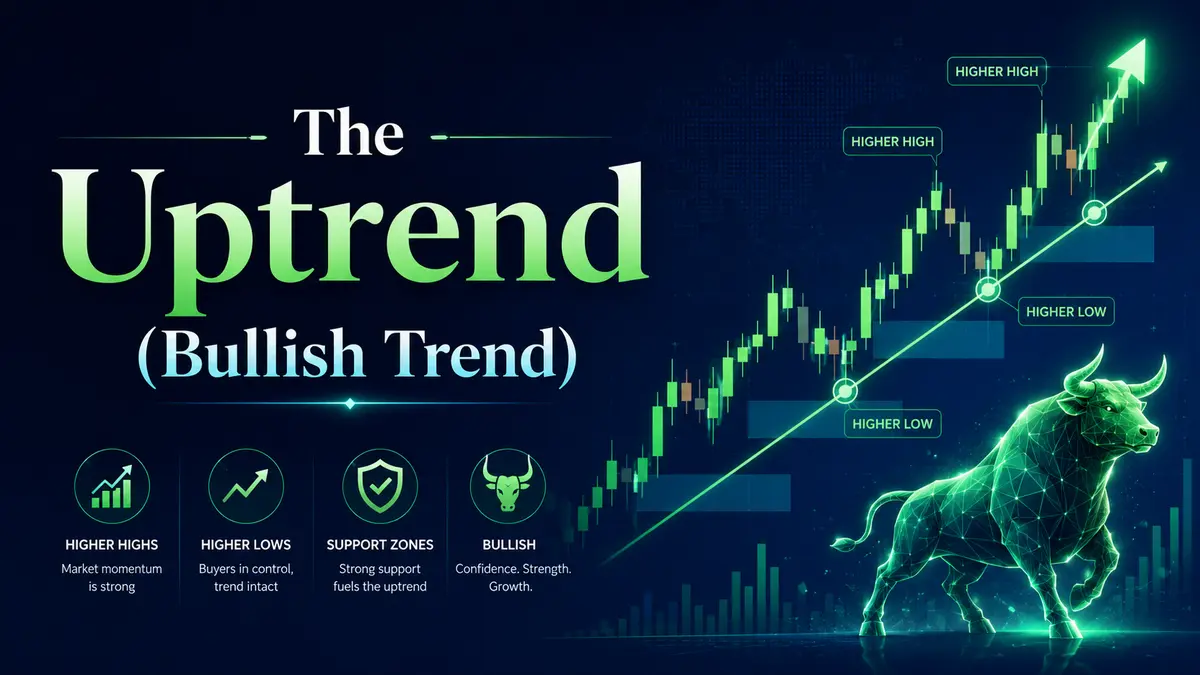
If you observe a chart and can identify at least two consecutive, rising price lows, you can confidently state that an uptrend has formed in the market. In trading terminology, this is commonly referred to as a “bullish” trend.
Behind the scenes, this pattern reflects a fundamental shift in market psychology. It means that buyers are consistently more aggressive than sellers. Even when the price naturally pulls back, buyers are eager to step in at a higher price than they did during the previous dip, which creates a staircase-like structure of higher lows.
Mapping the Market: Support and Resistance Lines
To forecast future price movements and generate actionable trading signals, we need to apply auxiliary lines to our chart. These lines are foundational to technical analysis.
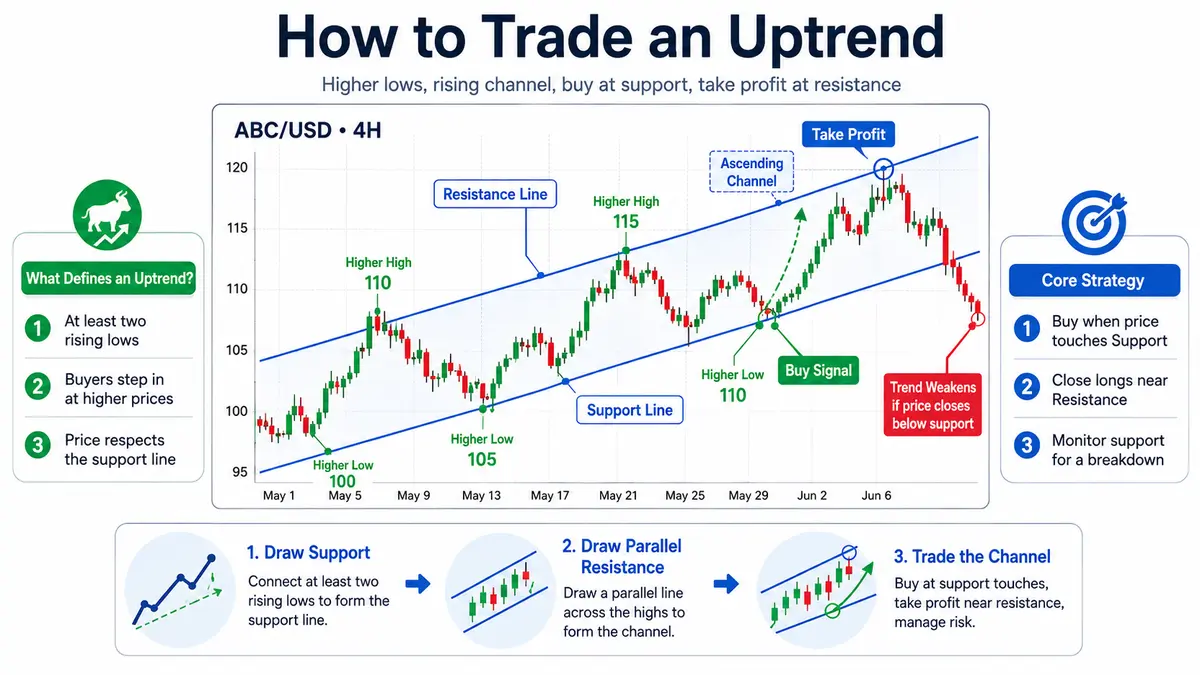
Because an uptrend is defined by a sequence of rising lows, our first step is to draw a straight line connecting these minimum points. This is your Support Line.
Think of it as a rising floor that catches the price every time it drops.
However, to get a complete and detailed technical picture, we need a ceiling to match our floor. We do this by drawing a second line perfectly parallel to the Support Line, but this time connecting the price highs. This is known as the
Resistance Line.
By plotting both lines, you create an ascending price channel. This channel gives you a distinct visual framework for making predictions. According to the first law of price movement — which states that an active trend is mathematically more likely to continue than to reverse—we can assume this upward momentum will persist.
Because rising prices are the path of least resistance, we know the lowest available price will consistently hover near the Support Line.
Practical Example: Imagine you are tracking a stock that is steadily climbing. It bounces off a support level at $100 and rallies to a resistance peak of $110. It then pulls back, but buyers step in at $105, creating a new, higher low. You draw your Support Line connecting $100 and $105. When the price rallies to $115 and pulls back a third time, touching your extended Support Line at $110, this is your optimal signal to execute a buy order.
The Breakout: Can Prices Fall Below Support?
A common question arises: is it possible for the price to drop below this Support Line?
Absolutely. The market is dynamic. However, if the price decisively breaks and closes below your Support Line, it is a glaring red flag. A broken support level is the very first technical signal that the current bullish trend has exhausted itself and is ceasing to exist. As long as the prices remain above the Support Line, the current bullish trend is considered valid and active.
Generating Trading Signals
Understanding the trend channel allows you to open highly effective, low-risk positions.
The Resistance Line acts as a boundary that temporarily caps the price growth.
When the price approaches this upper ceiling, it provides an excellent opportunity to close your long trades and secure your gains.
The core strategy for an uptrend:
-
Buy when the price dips and touches the Support Line.
-
Take Profit (Close the position) when the price rallies and touches the Resistance Line.
-
Monitor the Support Line constantly to ensure the market hasn’t broken through it, which would invalidate your setup.
The Rules of Correct Trendline Construction
Drawing lines on a chart might seem arbitrary, but precision is everything. An incorrectly drawn trendline will give you false signals and lead to losing trades.
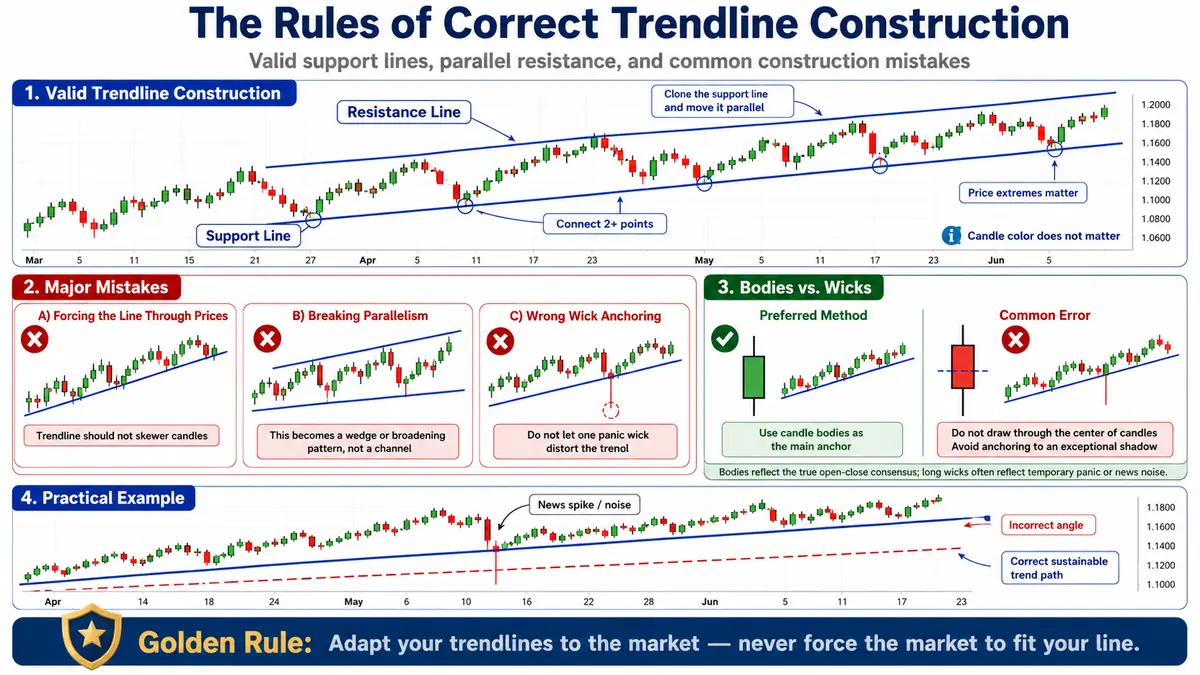
A valid Support Line must connect two or more points on the chart (in this context, a “point” refers to a candlestick). The color of the candlestick — whether it is a bullish green candle or a bearish red candle — is completely irrelevant. Your primary focus must be on the price extremes: the absolute minimums and maximums.
To create your Resistance Line, you do not draw a completely new, independent angle. Instead, you clone your properly drawn Support Line and drag it parallel to rest on the upper peaks.
Major Mistakes in Trendline Construction
Traders, especially beginners, often try to force the market to fit their desired narrative. Here are the most common fatal errors when charting an uptrend:
-
Forcing the Line Through Prices You cannot draw a line that blatantly slices through the middle of candlestick bodies just to connect two distant points. Your trendline should act as a boundary or a perimeter fence; it should never act like a skewer. If you have to cut through a cluster of candles to make your line work, the trendline is invalid.
-
Breaking Parallelism An ascending channel relies on geometry. You must not violate the parallel nature of the trend. If your Support Line and Resistance Line are drastically converging or diverging, you are drawing a completely different technical pattern (like a wedge or a broadening formation), not a standard trend channel.
-
Misunderstanding Wicks vs. Bodies This is a topic of heavy debate among trading experts. When identifying your anchor points, should you draw the line connecting the extreme tips of the candlestick shadows (the wicks), or should you connect the real bodies of the candles?
While some argue for using the extreme wicks, our preferred methodology relies on the candle bodies. Here is how to apply it correctly:
-
The Correct Anchor: The line should pass right along the edge of the candlestick’s real body, gently grazing it.
-
The Mistake: The most common error is drawing the line straight through the vertical center of the candle, or stubbornly anchoring it to the tip of an exceptionally long shadow.
Why focus on the bodies? Long shadows (wicks) often represent momentary market panic, low liquidity, or rapid news reactions that are immediately rejected by the market. The real body of the candlestick, however, represents the true consensus of where buyers and sellers agreed to open and close the session.
Practical Example: Suppose a sudden, unexpected news headline causes a currency pair to flash-crash by 50 pips in one minute, leaving a massive wick on the chart before instantly recovering. If you draw your Support Line connecting the very bottom tip of that chaotic wick, your line’s angle will be far too steep or shallow. By drawing your line along the solid edges of the candlestick bodies, you filter out the market noise and capture the true, sustainable trajectory of the trend.

Comments
No comments yet. Be the first to share your thoughts!
Authentication Required
You must be logged in to post a comment.