

The Three Axioms of Technical Analysis

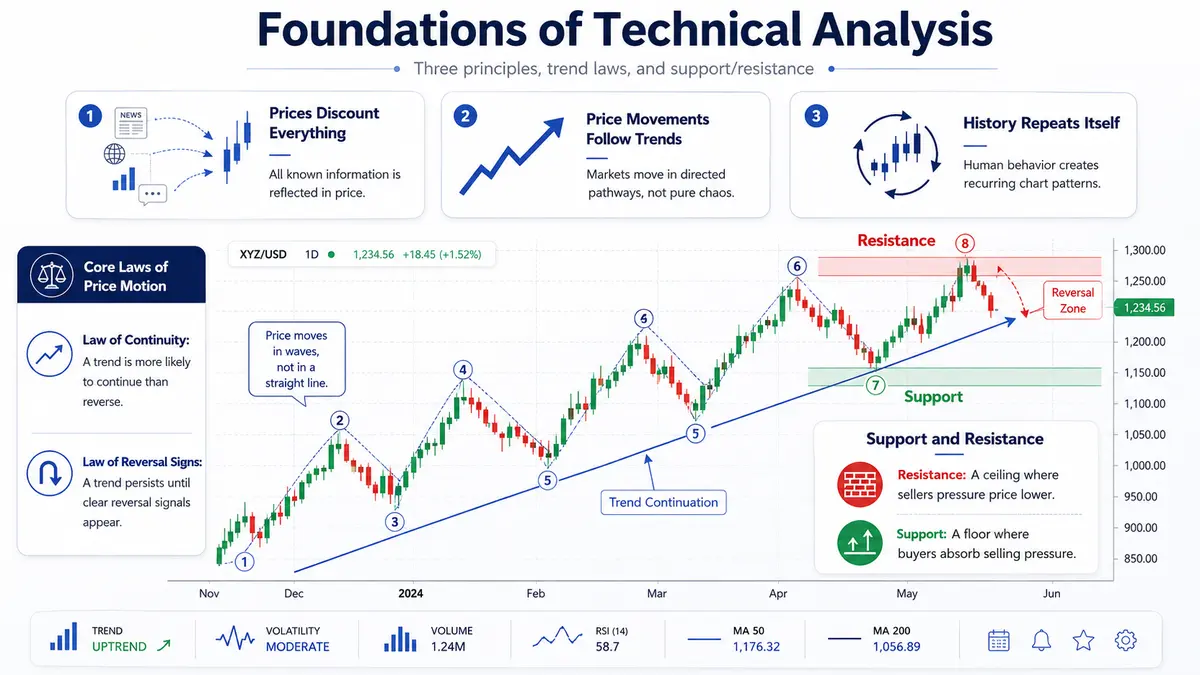
Before drawing lines on a chart, you must understand the foundational beliefs that make technical analysis work. These three principles explain why looking at past price action can help you forecast future market directions.
1. Prices Discount Everything
This means that every piece of information, every economic report, every political event, and every shift in supply and demand is already factored into the current market price.
A real-world perspective: Charts do not draw themselves. Every single candlestick or price tick is the direct result of buyers and sellers interacting. If a company releases stellar earnings, you don’t need to manually calculate the economic impact; you will immediately see it reflected in a surging price chart. For a technical analyst, studying the raw price action is more efficient than chasing down endless news stories, because the market has already processed that news for you.
2. Price Movements Follow Trends
Prices do not move in completely random, chaotic patterns. Instead, they move in directed pathways called trends. The ultimate goal of studying price charts is to identify these trends in their infancy so you can open positions in harmony with the prevailing market momentum.
3. History Repeats Itself
As the old proverb reminds us, “studying the past allows us to know the present.” Human nature does not change over time. The collective emotions of market participants — greed, fear, hope, and panic — manifest as identical visual chart patterns decade after decade. Because traders react similarly to risk and reward today as they did fifty years ago, specific price behaviors from the past remain highly reliable predictors of future price movements.
The Core Laws of Price Motion
Derived directly from the trend axiom, two critical laws dictate how trends operate. Think of these as the laws of market inertia:
-
The Law of Continuity: A trend currently in motion is statistically much more likely to continue its path than it is to suddenly reverse.
-
The Law of Reversal Signs: A trend will keep driving forward in its established direction until it displays definitive, structural signs of exhaustion and reversal.
As a trader, your job is to assume the trend is your friend until it proves otherwise.
Foundations of Support and Resistance
To capitalize on these market laws, you need to know where a trend is likely to pause, bounce, or break. This is where support and resistance zones come into play.
Prices do not move in a straight line; they advance in a series of zigzag patterns.
-
Resistance: When the market enters a strong rally and then temporarily pulls back, the highest peak reached before the decline is called resistance. It acts as a ceiling, stopping the price from moving higher because sellers are overwhelming buyers.
-
Support: When the price falls and then begins to turn back upward, the lowest point reached before the rally resumes is called support. This acts as a floor, preventing the price from falling further because buyers are stepping in with enough demand to absorb the selling pressure.
The Concept of Zones Over Exact Numbers
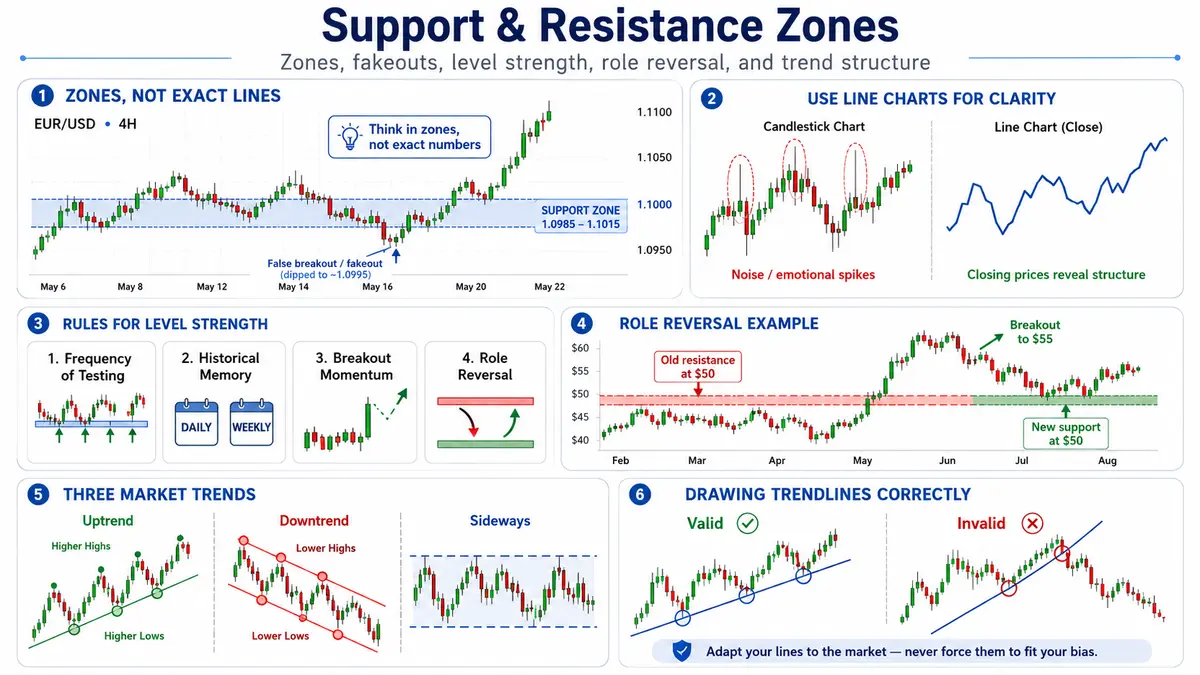
One of the most common pitfalls for developing traders is treating support and resistance as razor-thin, exact numbers. Support and resistance are zones, not lines.
If you view support as an exact number — say, exactly $1.1000 on EUR/USD — you might panic and think the level has been shattered if the price dips to $1.0995. However, the price will frequently break an exact level temporarily just to test the surrounding liquidity before aggressively reversing. This is known as a false breakout or a “fakeout.”
Using Line Charts for Clarity
To filter out the confusing noise of short-term market panics, try switching your terminal from a candlestick chart to a simple line chart.
Candlestick charts show the absolute highest and lowest prices reached during a specific timeframe (the wicks or shadows), which are often driven by brief, emotional spikes. Line charts, on the other hand, connect only the closing prices.
Because closing prices represent the final consensus value at the end of a session, they reveal the true peaks and troughs of the market structure, helping you distinguish between authentic breakouts and temporary market noise.
Rules for Evaluating Level Strength
Not all support and resistance levels are created equal. To judge how much weight a specific zone carries, keep these four rules in mind:
-
Frequency of Testing: The more times a price hits a support or resistance level without breaking it, the stronger and more psychologically important that level becomes to the rest of the market.
-
Historical Memory: A level that has successfully turned the market around on a daily or weekly chart carries significantly more influence than a level identified on a 5-minute chart.
-
Breakout Momentum: The significance of a breakout is directly tied to the historical strength of the level. If a price breaks through a major resistance zone that held firm for six months, the resulting price explosion will be far more violent than a breakout through a weak, newly formed level.
-
Role Reversal (The Principle of Interchangeability): When a price finally breaks through a strong resistance level, that level flips its identity and becomes a new support floor. Conversely, once a support floor is broken, it routinely transforms into a resistance ceiling.
An Example of Role Reversal
Imagine a stock struggling to break past a $50 resistance ceiling for several weeks. Buyers finally break through, pushing the price up to $55.
When the price eventually pulls back toward $50, the traders who missed out on the initial breakout see a second chance to buy at a historically significant price.
Additionally, short-sellers who lost money during the breakout will look to close their losing positions at breakeven. This collective influx of buying pressure turns the old $50 resistance ceiling into a brand-new support floor.
Identifying and Mapping the Three Trends
Markets move in three structural directions:
-
Uptrend (Bullish Trend): Characterized by a steady structure of higher highs and higher lows. Demand systematically overpowers supply.
-
Downtrend (Bearish Trend): Characterized by a structure of lower highs and lower lows. Supply consistently outpaces demand.
-
Sideways Trend (Ranging Market): Occurs when the price peaks and troughs bounce back and forth within a relatively flat horizontal corridor. Buyers and sellers are in a state of equilibrium.
Drawing Trendlines Correctly
Trendlines are an exceptionally powerful tool, but they are only useful if drawn accurately. A vital rule to live by: Never force a trendline to fit your biases. If a line does not naturally connect the market’s major turning points, the line is invalid. You must adapt your lines to the market, never the other way around.
-
Identify two primary anchor points on your chart.
-
For an uptrend, draw your straight line along the major rising valleys (support points) beneath the price action.
-
For a downtrend, draw your straight line along the major falling peaks (resistance points) directly above the price action.
-
The Rule of Three: While it only takes two points to construct a trendline, the line is not considered fully verified until a third independent point touches the line and bounces off it. The more touches a trendline boasts, the more market participants are watching it, and the more powerful the eventual breakout will be.

Comments
No comments yet. Be the first to share your thoughts!
Authentication Required
You must be logged in to post a comment.