Bar Pipa
We pay for a post of 10$

News

Chips Rebound. Oil Surges for a Third Day. Brent Clears $80. Bonds Are Getting Routed. The RBNZ Just Hiked for the First Time in Three Years

Chips Rebound. Oil Surges for a Third Day. Brent Clears $80. Bonds Are Getting Routed. The RBNZ Just Hiked for the First Time in Three Years

Trump declared the ceasefire MoU “over” and the US struck Iran for a second straight day. Brent is above $80 for the first time since June 22. The 10-year JGB yield is at its highest since September 1996. US Treasuries have added 10 basis points this week. The RBNZ hiked 25bp to 2.50% and signalled more. And Asia’s chipmakers are up 3–7% on a single Nvidia headline. Two completely different markets. Same session.

HIGHEST CONVICTION: USD/JPY is failing to track its own yield support near the 40-year peak. The pair eased 0.2% to 162.42 even as US 10-year yields climbed. Intervention risk and matching JGB yield rises are the explanation. This is a fade, not a chase.


The Oil Story That Is Breaking Bonds

President Trump declared the US-Iran ceasefire memorandum of understanding “over.” The US military launched fresh strikes on Iran for a second consecutive day, this time specifically targeting infrastructure that would help reopen the Strait of Hormuz. Brent crude cleared $80 per barrel for the first time since June 22, up roughly 9% on the week. WTI trades near $74.40. Trump said later he does not expect a return to full-scale war, which capped the initial panic, but the damage to inflation expectations was already done.

Fed funds futures now imply about 38 basis points of policy tightening this year, back to where pricing sat a week ago. Wednesday’s FOMC Minutes showed that a handful of participants already saw a case for raising rates in June before the committee agreed to hold. The oil-driven repricing is pulling Fed expectations back in a hawkish direction at the worst possible time for bond markets.

The 10-year JGB yield just hit its highest level since September 1996. Australia’s 10-year is at its highest since early June. The US 10-year...


Continue reading...
0
0

Rand Falls to One-Week Low Amid Tensions Around Iran

Rand Falls to One-Week Low Amid Tensions Around Iran

Introduction: The Wednesday When Geopolitics Turned Markets Around

Wednesday. Johannesburg, the JSE stock exchange. Traders who had hoped for a calm day in the morning saw their screens turn red. The South African rand, the country’s main currency, fell to its lowest level in a week. 16.3850 per dollar — a loss of about 0.5% compared with the previous close. This is not a collapse, but it is a serious decline that reflects global fear.

What happened? U.S. President Donald Trump announced the breakdown of a temporary peace agreement with Iran. And that changed everything. Iran’s Revolutionary Guards launched strikes on U.S. military facilities in Bahrain and Kuwait. The U.S. response was immediate. Geopolitical tensions in the Middle East erupted with renewed force.

For markets, this means the return of fear. Investors who had only just begun to believe in stabilization are once again fleeing into safe-haven assets. Emerging market currencies, including the rand, are coming under pressure. The dollar, by contrast, remains stable, while oil prices jump by more than 5%, reaching a two-week high.

The rand, as a typical emerging market currency, is sensitive to global risks. When geopolitical tensions rise, investors pull capital out of developing countries and move it into safer assets. This leads to currency weakness.

What comes next? Analysts expect the rand’s short-term dynamics to remain closely tied to developments in the Middle East, as well as to the release of the Federal Reserve meeting minutes scheduled for the same day. If the conflict escalates, the rand may fall even further. If the situation calms down, it may recover.

Let’s break down what is really happening, why Iran has once again become the main topic for markets, and how this affects the South African currency.

Breakdown of the Peace Agreement: What Happened

Trump Breaks...

Continue reading...
0
0

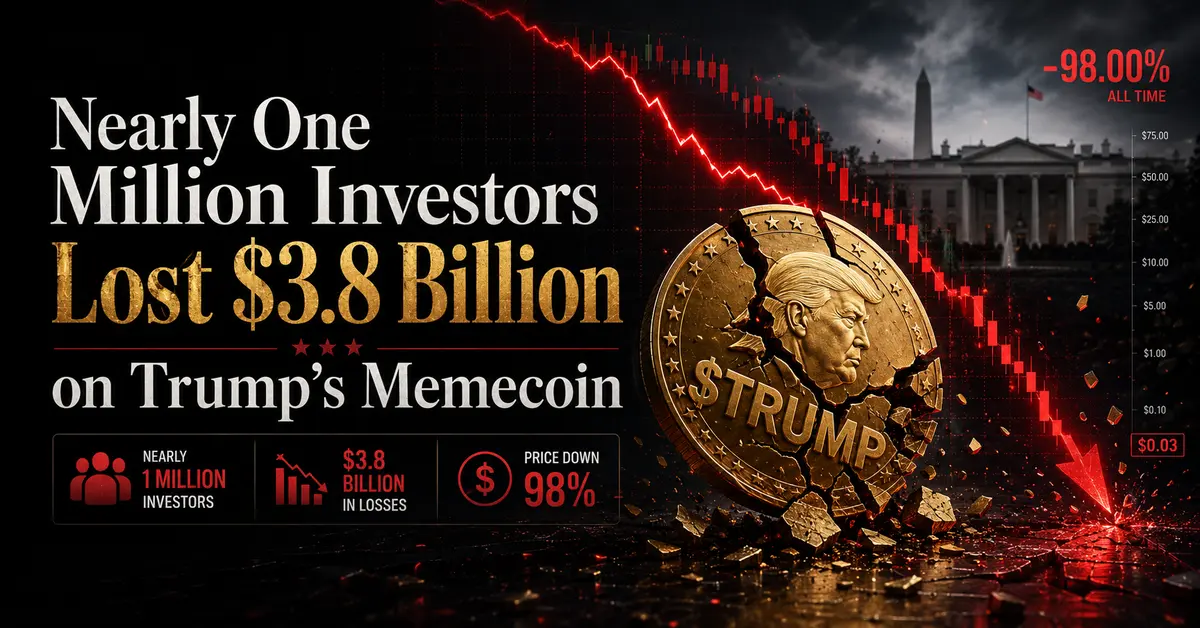
Nearly One Million Investors Lost $3.8 Billion on Trump’s Memecoin

Nearly One Million Investors Lost $3.8 Billion on Trump’s Memecoin

Introduction: The Sunday When Illusions Collapsed

Sunday. $TRUMP is trading at $1.69. That is almost 98% below its all-time high of $75.35, reached at the peak of the hype. The numbers that were supposed to make people rich instead left them with empty wallets and the bitter realization that they had become part of one of the biggest financial disasters in crypto history.

Nearly one million people. 988,905 accounts, to be exact. That is roughly two out of every three $TRUMP buyers. Together, they lost a total of $3.8 billion. Not thousands, not millions — billions. With a capital “B.” This was not just a bad investment. It was a mass financial collapse, comparable in scale to pyramid scheme failures or the dot-com crash.

What happened? Trump announced the memecoin three days before his inauguration in January 2025. It was the peak of the hype. Crypto enthusiasts who had seen Dogecoin and Shiba Inu turn ordinary people into millionaires rushed to buy. They believed that Trump’s brand, his political influence, and the buzz around his return to the White House would turn $TRUMP into the next gold mine.

But reality proved brutal. A memecoin is not an investment — it is a bet on hype. And when the hype disappeared, the price collapsed. Those who bought at the peak were left with almost nothing. Those who bought near the bottom also lost money, because the bottom kept moving lower.

Trump, meanwhile, earned $636 million from this memecoin. That is almost half of the $1.4 billion he received from the crypto industry last year. His administration, to put it mildly, was in no rush to regulate the industry. The SEC stated that it would not regulate memecoins as securities and withdrew a number of lawsuits against crypto companies.

Let’s break down...

Continue reading...
0
0

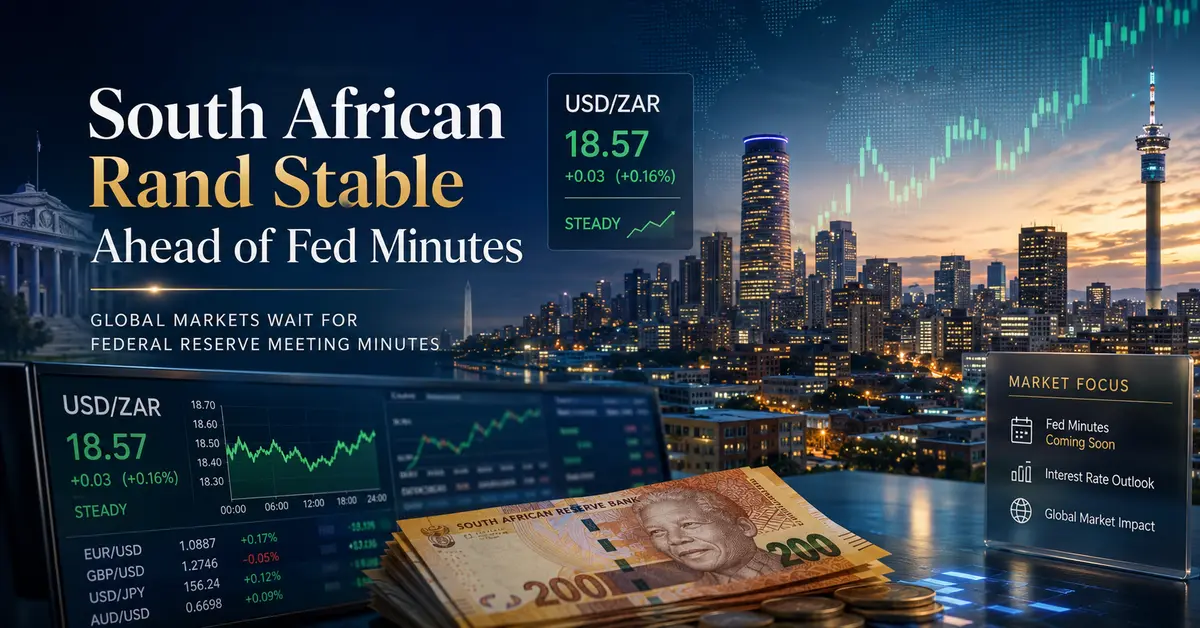
South African Rand Stable Ahead of Fed Minutes

South African Rand Stable Ahead of Fed Minutes

Introduction: South African Currency Pauses Before a Signal from Washington

Monday, Johannesburg. Traders on the JSE are watching their screens, but the market has frozen in a strange state of suspense. The South African rand remained virtually unchanged against the dollar, holding at 16.2450 per dollar. This is not a decline, nor a rise — it is the calm before the storm. And that storm will come from Washington, where the minutes of the Federal Reserve meeting are set to be published this week.

What is happening with the rand? South Africa’s currency, like many other emerging-market currencies, has paused in anticipation of signals from the Fed. Fed Chair Kevin Warsh gave limited guidance on the direction of monetary policy. Last week, he said that those expecting the regulator to soften its stance on inflation may be “disappointed.” However, he also noted that inflation has eased somewhat recently. These mixed signals are leaving markets uncertain.

The dollar traded 0.2% higher against a basket of currencies, but this modest move does not provide a clear direction. Investors are waiting for the publication of the minutes, which may offer key clues about how the Fed views the future path of interest rates.

In the absence of major domestic economic releases, the South African rand typically reacts to global factors. South Africa’s economic calendar this week is only moderately busy: foreign reserve data for June is scheduled for Tuesday, while industrial production figures for May are due on Thursday. These are not the kinds of events that can radically change the currency’s direction.

For now, the rand remains stable, but this stability is deceptive. Once the Fed minutes are released, the market may come back to life. The direction of that movement will depend on what U.S. policymakers say.

Let’s break down why...

Continue reading...
0
0
Tom Maffin

ITV Sells Its Media Division to Sky for £1.6 Billion: The British Media Market Rewrites the Rules of the Game

ITV Sells Its Media Division to Sky for £1.6 Billion: The British Media Market Rewrites the Rules of the Game

Introduction: The Monday That Changed British Television

Monday morning. London, ITV headquarters. Sky CEO Dana Strong is preparing for a press conference that will become one of the most significant moments in the history of British media. ITV, the UK’s largest commercial free-to-air broadcaster, announces the sale of its media and entertainment division to Sky. The value of the deal is £1.6 billion. And this is not merely the sale of an asset — it is a tectonic shift in the British media market.

For £1.6 billion (£1.2 billion in cash plus a potential additional payment of up to £200 million), Sky is getting far more than just television channels. It is gaining access to a vast free-to-air television audience and to brands that every Briton knows. As part of the deal, ITV receives Love Productions, the producer of The Great British Bake Off, which will become part of ITV Studios.

What lies behind this deal? Why has ITV, one of the oldest and most recognizable media brands in the UK, decided to sell its media and entertainment division? And why has Sky, which already dominates the pay-TV market, decided to expand through free-to-air content?

The answer lies in the same force that has transformed virtually every part of the media industry over the past decade: streaming. The rise of YouTube, Netflix, Amazon, and Disney is forcing traditional broadcasters to look for new paths to growth. The combination of free-to-air television with pay-TV and streaming is a response to the challenges of a new era. Let’s examine what really happened and what it means for the future of British media.

Deal Details: Figures, Structure, and Consequences

£1.6 Billion and Another £200 Million on Top

The figures announced on Monday are impressive. The £1.2 billion in cash forms the basis of...

Continue reading...
0
0

Thales Acquires Exail Technologies for €3.9 Billion: A Bet on Underwater Technologies and European Sovereignty

Thales Acquires Exail Technologies for €3.9 Billion: A Bet on Underwater Technologies and European Sovereignty

Introduction: The Monday That Changed Europe’s Defense Landscape

Monday morning. Paris, Thales headquarters. Chairman and CEO Patrice Caine holds a press conference that will become one of the most significant moments in the history of the French defense industry. Thales, a giant with €22.10 billion in revenue and 85,000 employees worldwide, announces the acquisition of a controlling stake in Exail Technologies. The deal is valued at €3.9 billion. The price per share is €134, which is 44% above the closing price before the news emerged.

Exail is not just a high-tech group. It is a European leader in robotic systems for naval mine countermeasures and the world’s second-largest player in shipborne inertial navigation systems. The company operates in nearly 80 countries, and its technologies have dual-use applications — both defense and civilian. Now it is becoming part of the Thales empire.

Behind this announcement lies something more than just an M&A deal. It is a strategic move that will strengthen Europe’s high-tech industrial base and reinforce its technological sovereignty. In a world where geopolitical uncertainty is becoming the new normal, Thales is betting on underwater warfare and inertial navigation — two areas that will be critically important in the coming decades.

Let’s examine what really stands behind this deal, what assets Thales is gaining, and why this acquisition could change the balance of power in the global defense market.

Exail Technologies: An Asset Worth Paying a Premium For

Who Exail Is and Why It Is So Valuable

Exail Technologies is not just a company with €479 million in revenue and 2,200 employees. It is a technological gem that has long remained in the shadow of larger players. But those who understand its capabilities know that Exail has unique competencies that cannot be replicated quickly.

Exail’s main specialization is underwater robotic...

Continue reading...
0
0

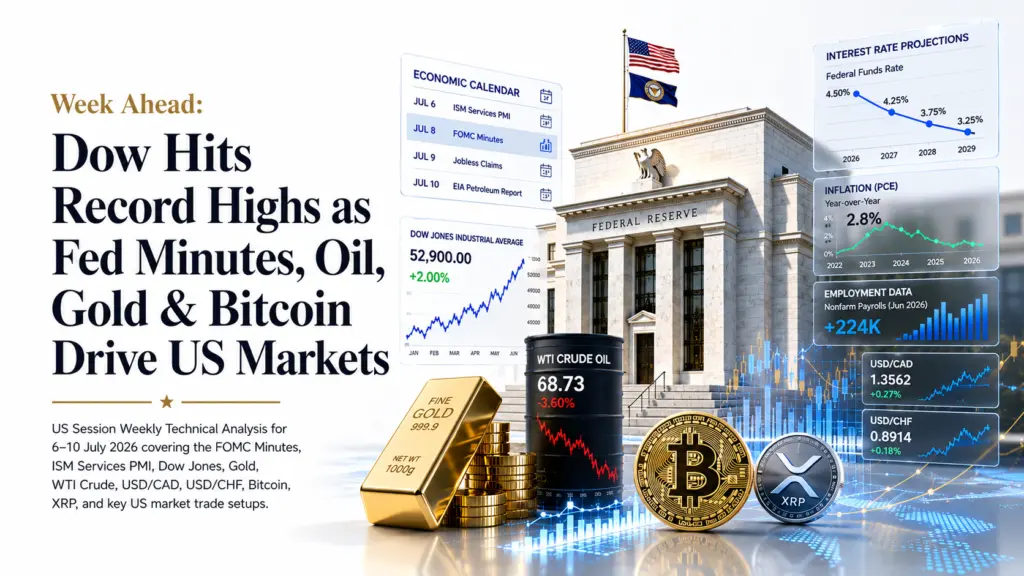
US Session Weekly | 6–10 July 2026 Dow Jones at Record Highs as Oil Slides on Hormuz Reopening, Gold Rebounds on Soft Jobs Data, and Bitcoin Claws Back From Extreme Fear

US Session Weekly | 6–10 July 2026 Dow Jones at Record Highs as Oil Slides on Hormuz Reopening, Gold Rebounds on Soft Jobs Data, and Bitcoin Claws Back From Extreme Fear

USD/CAD 1.4200 (7-month high range). USD/CHF 0.8032 (off 1-yr high 0.8139). Gold $4,174.71 (+2.3%) off $3,972 8-month low. WTI $68.73 (−3.6%) lowest since Feb. Dow record 52,900. US 10Y 4.48% (+6bps). BTC $62,641.86 (+7%) off June’s worst monthly close in 4 years. XRP $1.131 (+8%). FOMC minutes Wednesday.


LEVEL

HEADING INTO THE WEEK

USD/CAD

1.4200


USD/CHF

0.8032


Gold XAU

$4,174.71


WTI Crude

$68.73


Dow Jones

52,900.00


US 10Y Yield

4.48%


Bitcoin BTC

$62,641.86


XRP

$1.131


The holiday-shortened week of 29 June to 3 July turned on a single pivot: Thursday's 57,000 NFP print against a roughly 115,000 forecast, with 74,000 in downward revisions to prior months, cut September Fed hike odds from roughly 64 to 67% to roughly 50%. That data landed against the backdrop of a genuinely hawkish-leaning Fed hold earlier in June, and Warsh's Sintra remark that inflation expectations have come down gave markets room to price a more balanced outlook. The Dow closed at a fresh record 52,900.00, up 2% as capital rotated into blue-chip industrials while AI-linked semiconductor names -- Micron, Applied Materials, AMD, Sandisk -- sold off sharply on valuation concerns. Gold rebounded from an eight-month low as fading hike bets restored its appeal. WTI fell to its lowest since February as Hormuz flows normalised. Bitcoin rebounded 7% off June's worst monthly close in four years. XRP reclaimed $1.10 on a $281 million short squeeze. Wednesday's FOMC minutes are the week's tie-breaker.

FOMC Minutes Wednesday: The Week’s Single Most Important Release

The US 10-year yield at 4.48%, the Dow's record run, gold's rebound, and the broad-dollar bid behind USD/CAD's seven-month high are all suspended between two competing signals. The Fed's June hold left roughly half of FOMC members projecting at least one more 2026 hike...

Continue reading...
0
0

European Session Weekly | 6–10 July 2026 European Stocks Hit Record Highs on a Softer Dollar. A Cautious ECB and Wednesday’s Fed Minutes Set the Tone

EUR/USD 1.1437 (+0.5% wk). GBP/USD 1.3350 (+1.0%). Silver $62.37 (+4.1%). Wheat $5.88/bu (+2.1%). FTSE 100 10,634 (+2.9%) near 52-week high 10,935. Germany 10Y 2.95% (+6bps). ETH $1,753 (−2.9%). LTC $43.15 (+4.5%). ECB Accounts Thursday. FOMC Minutes Wednesday.


LEVEL

HEADING INTO THE WEEK

EUR/USD

1.1437


GBP/USD

1.3350


Silver

$62.37


Wheat CBOT

$5.88/bu


FTSE 100

10,634


Germany 10Y

2.95%


Ethereum ETH

$1,753


Litecoin LTC

$43.15


The week of 29 June to 3 July in the European session turned on Thursday's 57,000 NFP miss against a 115,000 consensus, which cut September Fed hike odds from roughly 67% to roughly 50% and drove a broad dollar retreat. EUR/USD reclaimed $1.14 on dollar weakness, not ECB strength -- Eurozone CPI undershot at 2.8% headline and 2.4% core, and Lagarde at Sintra described inflation and growth risks as more balanced, marking a clear softening from the hawkish June rate hike tone. GBP/USD reached a two-week high on the same dollar move, even as Bailey flagged a slowing economy without signalling imminent cuts. Silver rebounded sharply off seven-month lows. The FTSE 100 surged 2.9%, led by AstraZeneca, GSK, BAE Systems, and Babcock into a defensive-led rotation that insulated London from a global tech selloff. The week of 6 to 10 July asks whether this dollar-driven relief rally extends or fades as ECB Accounts, FOMC minutes, and UK political transition headlines take over.

EUR/USD at 1.1437: The ECB Accounts Are Thursday’s Gate

EUR/USD at 1.1437 sits roughly in the middle of its 2026 trading range -- above June's low of 1.1354 but well below January's high above 1.20. The analytical distinction the article makes explicit: the recovery was driven by broad US dollar weakness, not ECB hawkishness. Wednesday's Eurozone CPI came in below forecast at 2.8% headline and...

Continue reading...
0
0

Asia-Pacific Weekly | 6–10 July 2026 Yen Near Four-Decade Low as Intervention Risk Builds. Hang Seng Rebounds on Fed-Pause Bets. Crypto Extreme Fear Eases

Asia-Pacific Weekly | 6–10 July 2026 Yen Near Four-Decade Low as Intervention Risk Builds. Hang Seng Rebounds on Fed-Pause Bets. Crypto Extreme Fear Eases

USD/JPY 161.85 near 40-year yen low -- MoF may abandon advance signalling. AUD/USD 0.6940 off 3-month lows. Copper $6.11 awaiting binary tariff call. Nat gas $3.17 down 3.9%. Hang Seng 23,416 +3.3%. DOGE $0.0766 off $0.072 shelf. ADA $0.174 +19.2%. Van Rossem hard fork opens 8 July. China CPI Thursday. BOJ Summary of Opinions Tuesday.


LEVEL

HEADING INTO THE WEEK

USD/JPY

161.85


AUD/USD

0.6940


Copper COMEX

$6.11/lb


Nat Gas HH

$3.17/MMBtu


Hang Seng

23,416


Dogecoin DOGE

$0.0766


Cardano ADA

$0.174


The week of 29 June to 3 July was defined by a single pivot: Thursday's 57,000 NFP print against a 115,000 consensus, which cut September Fed hike odds from roughly 67% to roughly 50% and triggered a broad relief rally into the weekend. USD/JPY clawed back from its intraweek 40-year high as Reuters reported Tokyo may abandon advance intervention signalling -- a shift that caused a nearly 1% yen rally on one-sided positioning alone. AUD/USD recovered off three-month lows. The Hang Seng staged its sharpest rebound in months, adding 3.3% to recover from its prior week's worst single session in over a year. Cardano surged 19.2% -- the sharpest move in this report. The week of 6 to 10 July asks whether that Fed-pause relief rally has genuine follow-through, or whether three regional catalysts -- yen intervention risk, a binary copper tariff decision, and China's June inflation data -- reassert more cautious two-way price action.

USD/JPY at 161.85: The Week's Highest Tail Risk

USD/JPY at 161.85 sits within striking distance of the yen's weakest level in roughly forty years. Finance Minister Satsuki Katayama has repeatedly warned that authorities stand ready to respond appropriately at any time. Thursday's sharp, nearly 1% yen rally -- triggered by a Reuters report that Tokyo may...

Continue reading...
0
0

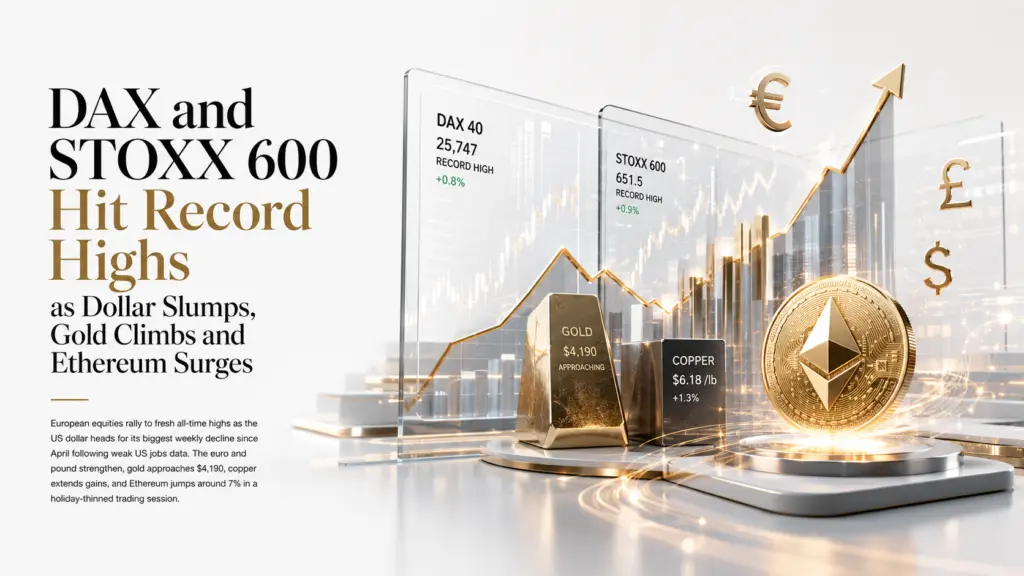
DAX and STOXX 600 Hit Record Highs as Dollar Slides Toward Worst Week Since April, Euro and Pound Rally, Gold Nears $4,190, Ethereum Surges 7%

DAX and STOXX 600 Hit Record Highs as Dollar Slides Toward Worst Week Since April, Euro and Pound Rally, Gold Nears $4,190, Ethereum Surges 7%

DXY ~100.8 -- on track for biggest weekly drop since early April. EUR/USD ~1.1443 two-week high. GBP/USD ~1.3365 best week in ~3 months. DAX 40 record ~25,747. STOXX 600 record ~651.5. Gold ~$4,185-$4,190. Copper ~$6.18/lb. ETH +7% to ~$1,717. Yen intervention watch live. US markets closed for Independence Day.

YEN INTERVENTION WATCH LIVE: FM Katayama issued fresh verbal warning Friday after yen touched 40-year low near 162.8 Thursday. Holiday-thinned session = elevated volatility risk.


LEVEL

SESSION STORY

EUR/USD

~1.1443

Two-week high. Up ~0.6% on week. Dollar weakness dominates over softer Eurozone CPI (headline 2.8%, core 2.4%).

GBP/USD

~1.3365

Best week in ~3 months (+1.2%). Bailey's Sintra remarks did little to slow the advance. Pure dollar-weakness story.

Gold XAU

~$4,185-$4,190

Extending advance. +1.3% on session. Dollar slide + reduced hike odds. WGC structural floor intact.

Copper

~$6.18/lb

+1.1-1.3% on session. Softer dollar + Goldman Sachs constructive demand commentary (EV, renewables, AI).

DAX 40

~25,747

Fresh all-time high. +0.65-0.9% on session. Siemens biggest boost (Kepler Cheuvreux upgrade). Defence names add.

STOXX 600

~651.5

Own record high. Best weekly rise since mid-May. Defence stocks +0.8% on Russia's deadliest Ukraine strike this year.

Ethereum ETH

~$1,717

+7%. Reclaims $1,700 handle. Sharp reversal after weeks of underperformance vs BTC.

Litecoin LTC

~$42.26

+~2%. Riding broader risk-on wave.

Natural Gas

~$3.25

Testing Fibonacci resistance inside descending channel. $3.245-$3.285 key band. Neutral-to-bearish structure.

Germany 20Y Bund

~3.30%

Easing from near two-week high as US Treasury yields pull back on reduced Fed-hike expectations.


Thursday's 57,000 NFP miss against a 115,000 consensus, combined with downward revisions to April and May payrolls, has done what five straight Nasdaq losing sessions and four straight gold weekly declines could not: it has cleanly broken the dollar's grip on European markets. The DXY has slipped to around 100.8, on track...

Continue reading...
0
0
Navigation menu
instaforex banner