Bar Pipa
We pay for a post of 10$

Indicies

DAX and STOXX 600 Hit Record Highs as Dollar Slides Toward Worst Week Since April, Euro and Pound Rally, Gold Nears $4,190, Ethereum Surges 7%
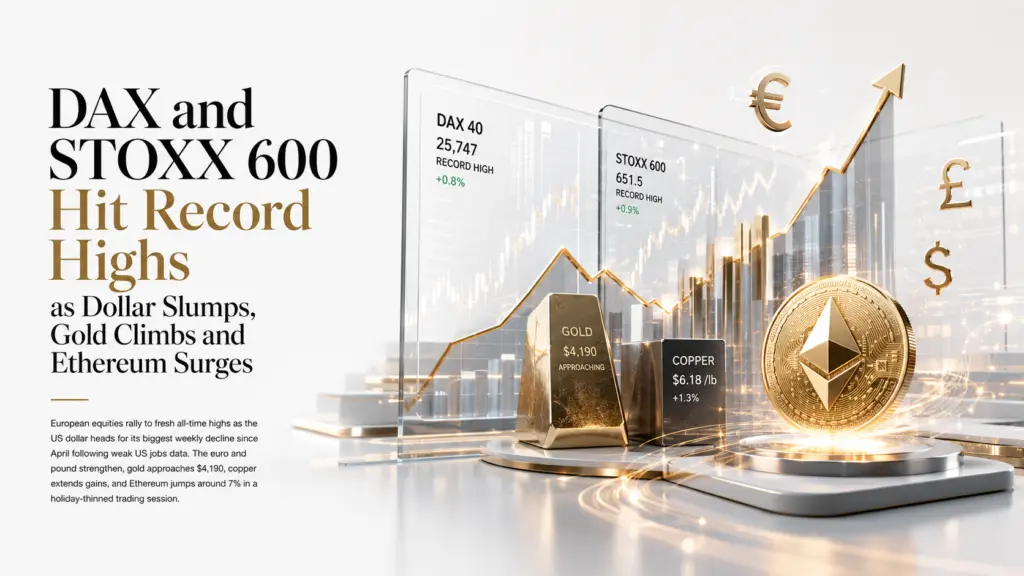
DAX and STOXX 600 Hit Record Highs as Dollar Slides Toward Worst Week Since April, Euro and Pound Rally, Gold Nears $4,190, Ethereum Surges 7%

DXY ~100.8 -- on track for biggest weekly drop since early April. EUR/USD ~1.1443 two-week high. GBP/USD ~1.3365 best week in ~3 months. DAX 40 record ~25,747. STOXX 600 record ~651.5. Gold ~$4,185-$4,190. Copper ~$6.18/lb. ETH +7% to ~$1,717. Yen intervention watch live. US markets closed for Independence Day.

YEN INTERVENTION WATCH LIVE: FM Katayama issued fresh verbal warning Friday after yen touched 40-year low near 162.8 Thursday. Holiday-thinned session = elevated volatility risk.


LEVEL

SESSION STORY

EUR/USD

~1.1443

Two-week high. Up ~0.6% on week. Dollar weakness dominates over softer Eurozone CPI (headline 2.8%, core 2.4%).

GBP/USD

~1.3365

Best week in ~3 months (+1.2%). Bailey's Sintra remarks did little to slow the advance. Pure dollar-weakness story.

Gold XAU

~$4,185-$4,190

Extending advance. +1.3% on session. Dollar slide + reduced hike odds. WGC structural floor intact.

Copper

~$6.18/lb

+1.1-1.3% on session. Softer dollar + Goldman Sachs constructive demand commentary (EV, renewables, AI).

DAX 40

~25,747

Fresh all-time high. +0.65-0.9% on session. Siemens biggest boost (Kepler Cheuvreux upgrade). Defence names add.

STOXX 600

~651.5

Own record high. Best weekly rise since mid-May. Defence stocks +0.8% on Russia's deadliest Ukraine strike this year.

Ethereum ETH

~$1,717

+7%. Reclaims $1,700 handle. Sharp reversal after weeks of underperformance vs BTC.

Litecoin LTC

~$42.26

+~2%. Riding broader risk-on wave.

Natural Gas

~$3.25

Testing Fibonacci resistance inside descending channel. $3.245-$3.285 key band. Neutral-to-bearish structure.

Germany 20Y Bund

~3.30%

Easing from near two-week high as US Treasury yields pull back on reduced Fed-hike expectations.


Thursday's 57,000 NFP miss against a 115,000 consensus, combined with downward revisions to April and May payrolls, has done what five straight Nasdaq losing sessions and four straight gold weekly declines could not: it has cleanly broken the dollar's grip on European markets. The DXY has slipped to around 100.8, on track...


Continue reading...
0
0
Lin Brings

Copper and Other Industrial Metals Rise Amid a Weaker Dollar

Copper and Other Industrial Metals Rise Amid a Weaker Dollar

Introduction: The Red Metal Is Back in Play

Friday. The London Metal Exchange is coming back to life. Copper, often called “Dr. Copper” for its remarkable ability to predict industrial cycles, is gaining nearly 1%. This is not just a random move. It marks the end of a two-week decline that had made investors nervous and forced them to reconsider their positions.

What changed? The dollar, the main enemy of commodity markets in recent months, has started to lose ground. The dollar index is falling for the second day in a row, making metals cheaper for holders of other currencies. Weak U.S. labor market data has reduced expectations of another Fed rate hike. And that was enough for industrial metals to breathe a sigh of relief and begin recovering.

But it is not that simple. Yes, copper rose by 0.7% to $13,413 per ton. Aluminum gained 0.6% to $3,110 per ton. Nickel posted an even more impressive increase — 1.8% to $16,540 per ton. Zinc and tin also became more expensive. But, as analysts note, the potential for this growth is limited, because weakness in traditional industrial sectors has not disappeared.

Let’s take a closer look at what is really happening in the industrial metals market, why the dollar has finally started to retreat, and whether this trend can last.

The Dollar Loses Ground: The Main Driver of Metal Prices

Weak Employment Data Hits Hawkish Expectations

It all started with U.S. labor market data released on Thursday. The figures were significantly weaker than forecast, and this changed the balance of power across all markets — from currencies to commodities. While just a week ago markets were confident that the Fed could raise rates this year, that confidence has now been shaken.

The CME FedWatch tool, which tracks the probability of...

Continue reading...
0
0

Kospi Rockets Past 6%, Yen Slides to a 40-Year Low, Gold Nears $4,200 as Asia Extends the Post-Payrolls Rally

Kospi Rockets Past 6%, Yen Slides to a 40-Year Low, Gold Nears $4,200 as Asia Extends the Post-Payrolls Rally

June NFP: 57,000 vs 115,000 consensus. Unemployment 4.2% (expected 4.3%). Fed September hike odds: 45-53%, from 65-67%. Dow Jones record close 52,900.07, +594.83 pts (+1.14%). Nasdaq -0.8%. S&P flat. US markets closed Friday for Independence Day. Yen at 40-year low 161.35. Kospi +6% intraday, triggers 'sidecar' halt.

57,000  June NFP  vs 115,000 consensus -- roughly half the forecast -- unemployment 4.2% vs 4.3% expected

52,900.07  Dow Jones close  +594.83 pts (+1.14%) -- fresh record high Thursday

45-53%  Sept hike odds  down from 65-67% before the payrolls report (CME FedWatch)


Thursday's NFP printed 57,000 against a 115,000 consensus -- roughly half of what the market expected. The unemployment rate came in at 4.2% against a 4.3% forecast, providing a modest offset that the market read as labour-market cooling rather than genuine downturn. Fed funds futures now imply a September hike probability of 45 to 53%, sharply down from 65 to 67% before the report. The combination produced a Dow Jones record close at 52,900.07, up 594.83 points, a 1.14% gain. The Nasdaq fell 0.8% and the S&P 500 finished essentially flat, underscoring a rotation away from megacap technology names even as the broader risk-on tone carried into Asia.

Friday's Asian session is the post-payrolls reaction carrying through a full trading day with US markets completely absent. South Korea's Kospi is the standout: reversing an early dip to surge more than 6% intraday and triggering a trading 'sidecar' halt as SK Hynix and Samsung Electronics both rallied more than 8% on renewed AI-chip demand optimism. This is a sharp turnaround after the index's roughly 8% slump earlier in the week. The USD/JPY intervention story is simultaneously live: the pair is holding above 161.00 but capped below 161.50, within a 161.00-161.74 day range, as Japan's Finance Minister Katayama repeats...

Continue reading...
0
0
Lin Brings

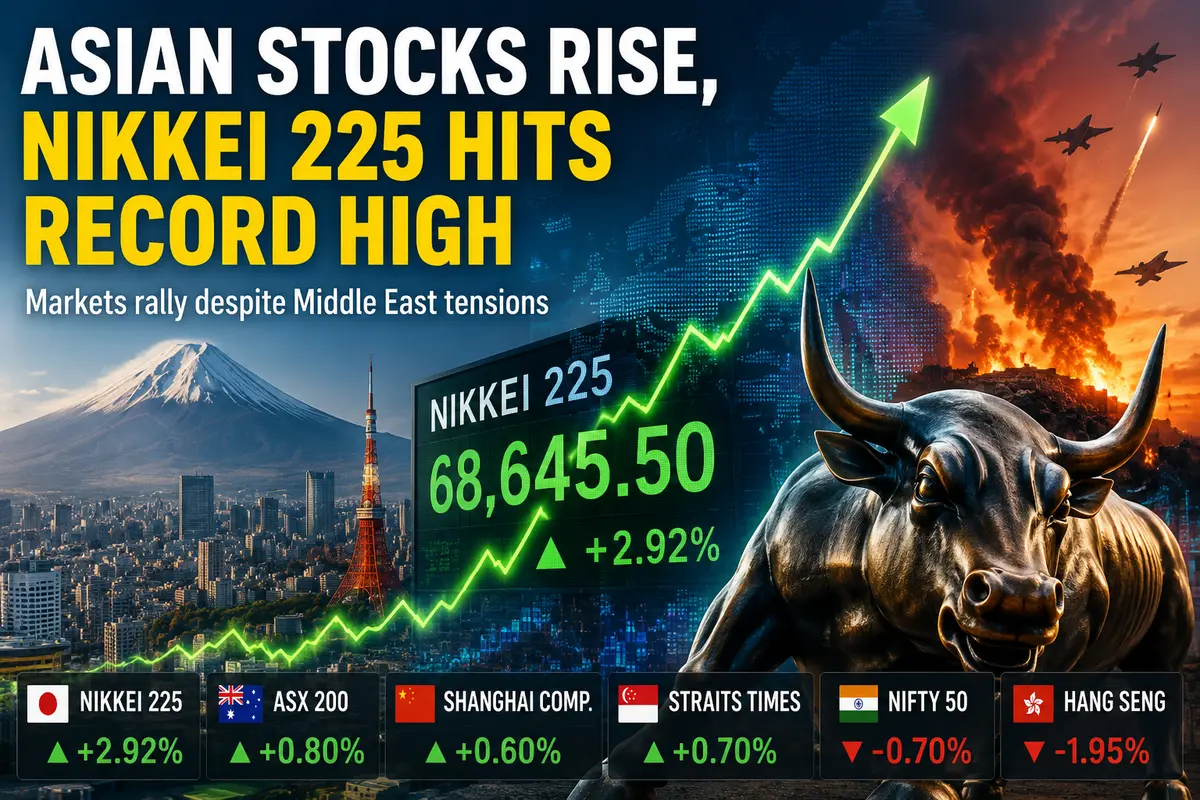
Asian Stocks Rise as Nikkei 225 Hits a Record High

Asian Stocks Rise as Nikkei 225 Hits a Record High

A Morning That Began With a Surge

Asian stock markets delivered a pleasant surprise on Wednesday, staging a remarkable rally despite a global backdrop that offered little reason for optimism. The Middle East remained engulfed in conflict. Iran and the United States exchanged airstrikes for the third time in a week. Oil prices climbed. Diplomatic negotiations stalled. Diplomats stayed silent while military forces took action.

Under such circumstances, most markets would be expected to fall—or at least pause in anxious anticipation. But Asian markets ignored the script. They rose. And not just modestly: Japan’s Nikkei 225 surged to an all-time record high, surpassing a milestone many believed was unattainable after three decades of economic stagnation.

What happened? Have investors stopped worrying? Or are they seeing something that analysts obsessed with geopolitics are missing?

As is often the case, the answer is more complicated. On Wednesday, Asia demonstrated a remarkable ability to tune out negative headlines and focus on the factors working in its favor. And there are plenty of them: a technology boom, government stimulus measures, and weak economic data that paradoxically reinforce expectations for accommodative monetary policy. Together, these factors created a cocktail strong enough to outweigh fears of escalating military conflict.

Japan: Thirty Years Later

The star of the day was Japan’s Nikkei 225. The index climbed nearly 3% to reach 68,645.5 points—an all-time high in its history dating back to 1950.

To appreciate the significance of this achievement, it helps to remember where Japan stood three decades ago. In 1990, the Nikkei collapsed following the bursting of the country’s asset bubble. Since then, despite periods of recovery and decline, the peak reached in 1989 had seemed permanently out of reach.

Now, a new record has been set.

The Nikkei was not alone in its triumph. The broader...

Continue reading...
0
0
BCR

Daily Analysis 3 July 2026 | Markets Reel as Weak US Jobs Data Hits Dollar, Lifts Gold

Daily Analysis 3 July 2026 | Markets Reel as Weak US Jobs Data Hits Dollar, Lifts Gold

Currency & Commodity Analysis:


US Dollar Index


Non-Farm Payrolls (Significant Decline): The actual increase was only 57,000, more than halved from the previous value of 170,000 (Note: the official value was 172,000), and far below the market expectation of 110,000. This indicates that the actual hiring intentions of US companies are on the verge of recession. The "ADP employment report showing only 98,000 new jobs," which was dismissed by the market a few days ago, turned out to be a genuine harbinger of an industry peak. In the foreign exchange market, this contradictory data triggered a sharp short-term "fan-like" price movement (sweeping orders up and down): the US dollar index fluctuated downwards: immediately after the data release, due to the unexpectedly low figure of 57,000, the US dollar index plummeted, directly testing the low of the trading range at 100.55. However, due to the still strong unemployment rate (4.2%) and wages (3.5%), the US dollar index quickly recovered some of its losses after hitting the low, indicating that the market is repeatedly tug-of-war between "speculation on the Fed's dovish stance" and "concerns about stagflation." The middle line of the long-term downward channel from 2022 to 2026 is currently undergoing a fierce battle for its position.


The current strengthening of the US dollar is not driven by a single factor. The Federal Reserve's completely hawkish shift in monetary policy, the stronger-than-expected resilience of the US job market, repeated geopolitical disturbances between the US and Iran, and a surge in US dollar and Treasury bond allocations driven by safe-haven buying in global equity markets—multiple factors have combined to create the current strong dollar. Simultaneously, the market has exhibited a unique divergence, with the dollar rising and US Treasury yields falling. The bullish trend of the US dollar index remains...

Continue reading...
0
0
BCR

Daily Analysis 2 July 2026 | Strong Dollar Pressures Gold While Oil Finds Stability

Daily Analysis 2 July 2026 | Strong Dollar Pressures Gold While Oil Finds Stability

Currency & Commodity Analysis:


US Dollar Index


The strengthening US dollar pushed the yen to its lowest level since 1986. The USD/JPY pair rose to 162.78 at one point, marking its fourth consecutive quarterly gain, the longest winning streak in four years. This was mainly due to the market increasingly pricing in a Fed rate hike – federal funds futures indicate a 65% probability of a September rate hike, coupled with strong US economic performance and inflation well above target, while Japanese interest rates remain significantly lower than US rates, resulting in a large yield gap that continues to benefit the dollar and sustain carry trades. The market is awaiting Thursday's US June jobs report (expected to show 110,000 new jobs and a 4.3% unemployment rate), while most US markets will be closed on Friday for Independence Day. Reduced liquidity could provide an opportunity to disrupt speculative short positions. Morgan Stanley believes the market's expectations for the Fed are too aggressive, predicting US inflation will be lower than official forecasts, thus reducing the likelihood of rate hikes. The current rebound in the US dollar index is not solely driven by safe-haven demand. The more crucial factor is the repricing of short-term interest rate expectations, coupled with the weakening of heavyweight currencies such as the euro and yen, keeping the index near its year-to-date highs.


The dollar is partly traded based on yield and partly on confidence in the institution's credibility. Political intervention does not necessarily negatively impact the dollar, but it makes trading less pure. This narrows the path for the dollar index's rise. Strong data, a hawkish Warsh, and a halt in oil price declines could still push the index above 102.0. However, the risk-reward ratio becomes less attractive. The dollar has already absorbed a significant...

Continue reading...
0
0
BCR

Daily Analysis 29 June 2026 | Rate Hike Bets Lift Dollar, WTI Rebounds Above $70 After 7.5% Weekly Drop

Daily Analysis 29 June 2026 | Rate Hike Bets Lift Dollar, WTI Rebounds Above $70 After 7.5% Weekly Drop

Currency & Commodity Analysis:


US Dollar Index


Last week, the US dollar index fluctuated around 101.40, reaching a 13-month high of 101.80, with June's gains potentially marking the largest in nearly a year. Rising expectations of a Fed rate hike, hawkish signals from Warsh, and a widening US-German interest rate differential exceeding 150 basis points collectively underpinned the dollar's strength. The core macroeconomic backdrop for the dollar's strength lies in the fact that energy price volatility triggered by the Middle East situation reversed market expectations for Fed easing this year. Previously, the market widely anticipated a Fed rate-cutting cycle, but geopolitical conflicts pushed up energy prices, exacerbating inflationary pressures and forcing the market to reassess its policy path. Simultaneously, consistently better-than-expected US economic data—recently, a broad-based strengthening of PMIs—reinforced the narrative of "American exceptionalism," providing solid fundamental support for the dollar.


Although the current "positive feedback loop" of the dollar is strong, this momentum could quickly exhaust itself under two key scenarios, triggering a risk of exchange rate correction. One is that inflation data falls short of expectations. The US core PCE inflation indicator for May was significantly lower than market expectations, indicating a continued easing of inflationary pressures. Investors' bets on a Fed rate hike in October will cool rapidly, and the dollar index may experience a rapid pullback, even erasing some of its recent gains. Secondly, geopolitical risks have eased significantly. If the US-Iran peace agreement negotiations achieve a substantial breakthrough, the situation in the Middle East stabilizes, and navigation in the Strait of Hormuz fully resumes, further declines in oil prices will alleviate global inflationary pressures, weakening the need for the Fed to maintain a hawkish stance, thereby diminishing the dollar's interest rate advantage and safe-haven support.


The dollar index is currently maintaining...

Continue reading...
0
0

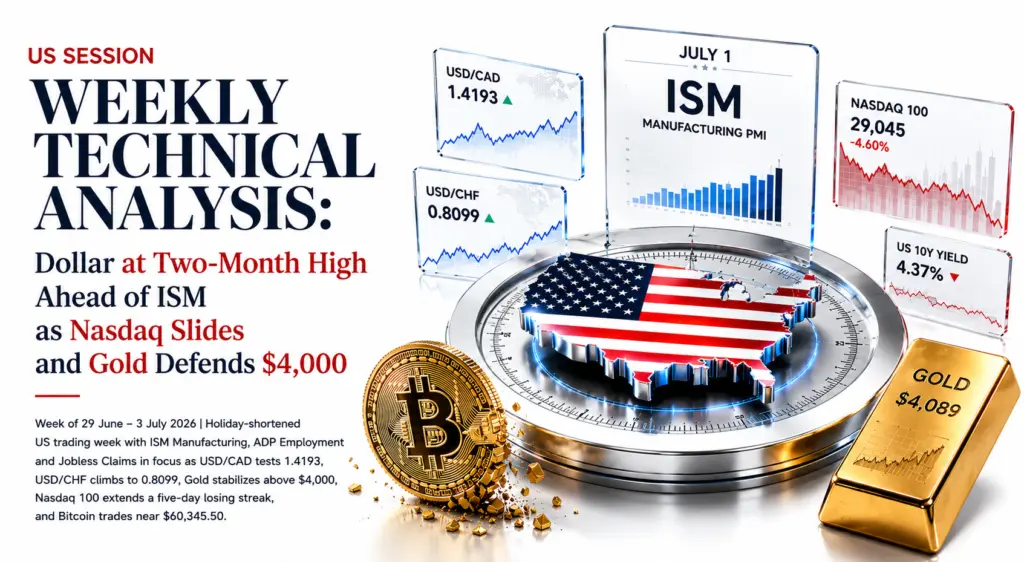
US Session Weekly | 29 June–3 July 2026 | Holiday-Shortened Week Dollar Hits Two-Month High. Nasdaq 100 Five-Day Losing Streak. Bitcoin at $60,345.50. ISM Manufacturing Is the Week’s Decisive Catalyst

US Session Weekly | 29 June–3 July 2026 | Holiday-Shortened Week Dollar Hits Two-Month High. Nasdaq 100 Five-Day Losing Streak. Bitcoin at $60,345.50. ISM Manufacturing Is the Week’s Decisive Catalyst

DXY above 100 for first time since May 2025. USD/CAD 1.4193 -- best since late January. USD/CHF 0.8099. Gold $4,089 after fourth consecutive weekly decline, briefly sub-$4,000. Nasdaq 100 -4.60% on five-day losing streak from June 3 record near 30,762. US 10Y 4.37% (-7bps). BTC $60,345.50 -- lowest since late 2024. ADA $0.146 multi-year lows. US markets closed Friday.


LEVEL

HEADING INTO THE WEEK

USD/CAD

1.4193

Five-month high (best since late Jan). Dollar + deteriorating Canadian growth + gold pullback. ISM Tue + NFP Thu are the gates.

USD/CHF

0.8099

DXY above 100 first time since May 2025. CHF safe-haven demand outweighed by greenback rally.

Gold XAU

$4,089

Fourth consecutive weekly decline. Briefly sub-$4,000 before Friday PCE bounce reclaimed $4K. $3,800-$3,900 structural floor.

Wheat CBOT

588.45c

Eased from 3-week high. Hormuz freight premium easing + improving US harvest + Black Sea conditions.

Nasdaq 100

29,045

-4.60%. Five-day losing streak from June 3 record near 30,762. Chip rout + delayed AI IPO headlines drove the fall.

US 10Y Yield

4.37%

-7bps. Seven-week low. In-line PCE trimmed (not eliminated) multiple-hike bets. Core PCE held at 3.4%.

Bitcoin BTC

$60,345.50

Lowest since late 2024. Spot ETF outflows accelerated. Capital rotating to defensive equity + AI infrastructure.

Cardano ADA

$0.146

Multi-year lows. Amplified BTC breakdown on smaller cap + thinner institutional liquidity.


A hawkish-priced dollar and a five-day Nasdaq losing streak. Does ISM Manufacturing on Tuesday deliver the reprieve, or does a holiday-shortened week with Friday closure deliver thinner liquidity and sharper moves?

USD/CAD at 1.4193: The Most Consequential North American Pair

USD/CAD at 1.4193 is the most consequential North American pair for the week. The loonie's slide to a five-month high in USD/CAD terms -- its best level since late January -- reflects a combination of broad-based dollar strength and a...

Continue reading...
0
0

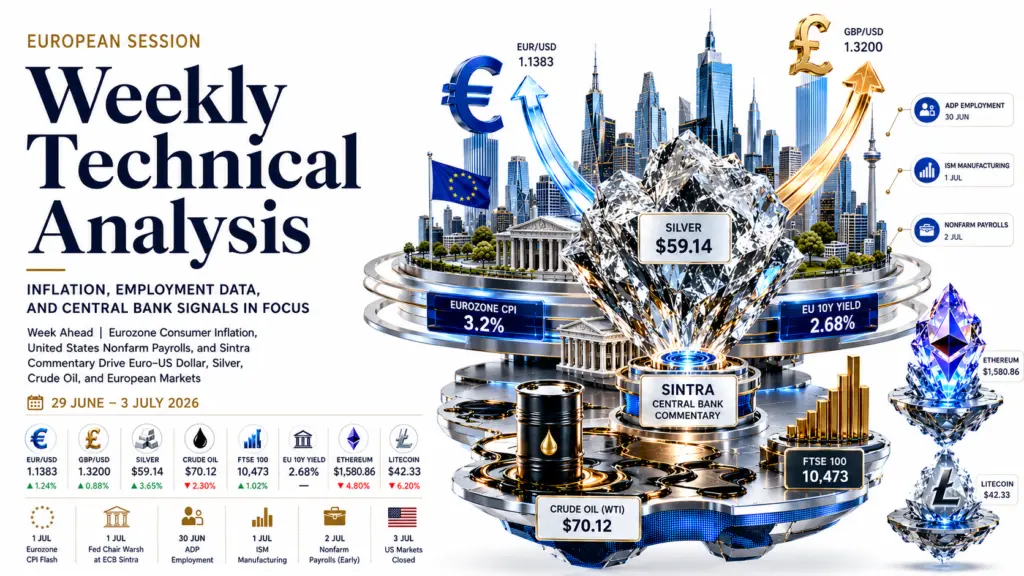
European Markets Weekly | 29 June–3 July 2026 Eurozone CPI Hits 3.2%. Nonfarm Payrolls Thursday. Warsh Speaks at Sintra Tuesday. EUR/USD Holds 1.1383 as Silver Breaks $59

European Markets Weekly | 29 June–3 July 2026 Eurozone CPI Hits 3.2%. Nonfarm Payrolls Thursday. Warsh Speaks at Sintra Tuesday. EUR/USD Holds 1.1383 as Silver Breaks $59

Holiday-shortened US week. EUR/USD 1.1383 -- strongest since late 2024. Silver $59.14. FTSE 100 at record 10,473. WTI $70.12. EU 10Y 2.68% stable. ETH $1,581 in Extreme Fear. LTC $42.48. Eurozone CPI Tuesday, ISM Manufacturing Tuesday, Warsh at Sintra Tuesday, ADP Wednesday, NFP Thursday.


LEVEL

HEADING INTO THE WEEK

EUR/USD

1.1383

Strongest since late 2024. Dollar softness, not ECB hawkishness, drove the move. Eurozone CPI Tuesday + Warsh Sintra = the twin gates.

GBP/USD

1.3200

Psychological pivot. Sterling benefited from dollar weakness + resilient UK services. GDP revision this week.

Silver XAG

$59.14

Multi-year high. Weaker dollar + green-energy demand signals. $59 is the intraweek pivot for continuation or reversal.

Crude Oil WTI

$70.12

OPEC+ supply-increase signals + soft Chinese demand. $70 structurally critical; break below opens mid-$60s.

FTSE 100

10,473

Record territory. Financials and consumer staples led. Energy lagged on crude weakness.

EU 10Y Yield

2.68%

Stable. Dollar weakness + soft US data offset French political noise. Eurozone CPI Tuesday is the next catalyst.

Ethereum ETH

$1,580.86

Extreme Fear. Tracking crypto-specific fear cycle, not macro risk-on. $1,500 demand shelf is structural anchor.

Litecoin LTC

$42.33

Broke below $45 support. Halving narrative is primary fundamental floor. $40 shelf = next accumulation zone.


EUR/USD at 1.1383: Dollar Weakness, Not ECB Strength

EUR/USD at 1.1383 is the most consequential European pair for the week, and the distinction between what drove it here and what can sustain it is analytically important. The pair's advance through 1.13 to its strongest level since late 2024 was driven by broad dollar softness -- soft US data reducing Fed tightening urgency -- not ECB hawkishness. That distinction matters because it creates a different set of conditions for how the pair behaves this week.

The dollar softness that drove EUR/USD to 1.1383 was itself a function...

Continue reading...
0
0

Asia-Pacific Weekly | 29 June–4 July 2026 BoJ Intervention Watch as USD/JPY Tests 162. China PMIs and the RBA Decision Steer Asian Risk. Crypto Braces for Extreme Fear

Asia-Pacific Weekly | 29 June–4 July 2026 BoJ Intervention Watch as USD/JPY Tests 162. China PMIs and the RBA Decision Steer Asian Risk. Crypto Braces for Extreme Fear

USD/JPY 161.53 pressing 52-week high of 161.95. China NBS and Caixin PMIs Monday. RBA rate decision Wednesday. BoJ Tankan Survey Tuesday. Solana post-unlock stabilising at $70.42. DOGE broke below the $0.085 demand zone at $0.074. Fear & Greed at 12 -- Extreme Fear.


LEVEL

HEADING INTO THE WEEK

USD/JPY

161.53

13-month high, pressing 52-week high 161.95. Intervention zone active. Tokyo CPI 1.7% adds BoJ hike urgency.

AUD/USD

0.6904

Weighed by dollar strength and soft China demand. RBA decision Wednesday is the directional gate.

Copper (HG)

$6.18

Eased on hawkish-Fed dollar bid. Renewables and electronics demand steady. Traditional Chinese demand soft.

Natural Gas

$3.28

+5.67% on the month. Above-average temperatures through early July. Record LNG feedgas at Golden Pass.

Hang Seng

22,946

Strong Sell technical reading. Near bottom of 22,485-28,056 yearly range. 52-week low risk active.

Nikkei 225

~69,683

Weak yen flattering large-cap exporters. Gains thin as intervention chatter builds.

Solana (SOL)

$70.42

Stabilising near $70 after June 624,666-token unlock. Fear & Greed at 12 (Extreme Fear). $66 support.

Dogecoin (DOGE)

$0.074

Broke below $0.085 demand zone. -14.35%. Steadier short-term MA structure the only technical support.


USD/JPY at 161.53: The Single Most Important Pair of the Week

USD/JPY at 161.53 is the single most important pair for the Asian session this week. The pair's grind to a fresh 13-month high is driven almost entirely by the dollar side: the Fed's hawkish hold under Chair Warsh, with nine of nineteen policymakers projecting at least one additional 2026 hike, has kept the DXY near a 13-month high and the US-Japan rate gap at 250 to 275 basis points. The BoJ hiked to 1.00% on June 19 -- the first time at that level since 1995 -- and Tokyo's June CPI accelerated to 1.7% headline and 1.6% core, giving the BoJ an...

Continue reading...
0
0
Navigation menu
instaforex banner