Bar Pipa
We pay for a post of 10$

Analytics

GFATHER

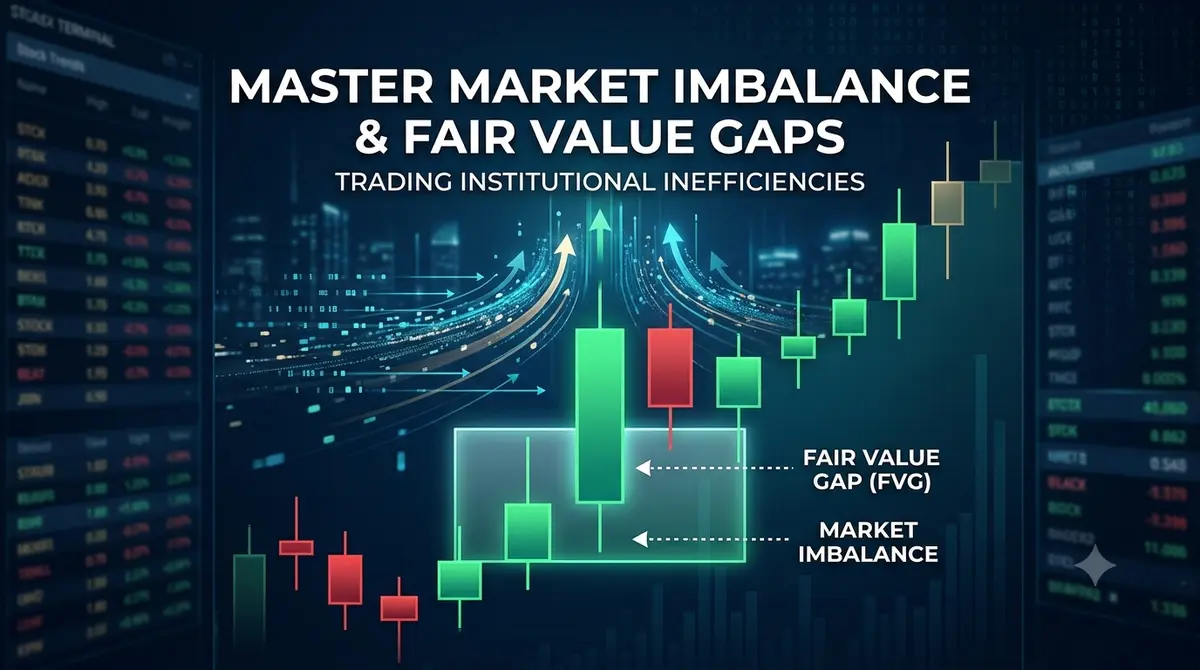
Master Market Imbalance & Fair Value Gaps: Trading Institutional Inefficiencies
Master Market Imbalance & Fair Value Gaps: Trading Institutional Inefficiencies

Master Market Imbalance & Fair Value Gaps: Trading Institutional Inefficiencies

We’ve all been there. You look at a chart, and out of nowhere, a massive green candle explodes upward. Panic sets in. You think, "If I don’t buy right now, I’m going to miss the whole move." So you hit market buy at the top—and almost instantly, price turns around and slams straight back down.

That FOMO trap destroys more trading accounts than almost anything else.

Professional traders look at those violent moves totally differently. When a huge candle tears through a chart, it leaves behind an inefficiency—what traders call a Fair Value Gap (FVG) or market imbalance. Instead of chasing the spike, pros mark that zone and sit back. They know price almost always comes back to fill the gap before the real move continues.

What Actually Is a Fair Value Gap?

In a normal, healthy market, buyers and sellers trade back and forth smoothly. Price moves up a bit, down a bit, and fills orders at every single price level.

An imbalance happens when an overwhelming chunk of institutional money hits the market all at once. Think big bank orders, CPI news releases, or session open spikes. The buying or selling is so aggressive that price literally skips levels, leaving a big pocket of un-filled orders behind.

Spotting an FVG comes down to a simple three-candle pattern on your chart:

  • Bullish FVG: Find a big, aggressive green candle (Candle 2). Now look at the candle before it (Candle 1) and the candle after it (Candle 3). If the high of Candle 1 and the low of Candle 3 don't overlap, that open gap in the middle is your bullish Fair Value Gap.

  • Bearish FVG: Find a strong red candle (Candle 2). If the low of Candle 1 and...

Continue reading...
0
0
GFATHER

Decoding Order Blocks & Supply/Demand Zones: Trading High-Probability Turnarounds

Decoding Order Blocks & Supply/Demand Zones: Trading High-Probability Turnarounds

Decoding Order Blocks & Supply/Demand Zones: Trading High-Probability Turnarounds

If market structure gives you the map and liquidity sweeps show you where the traps are laid, Order Blocks and Supply/Demand zones give you exact precision for entries.

Most retail traders struggle with timing. They either buy after a massive rally has already stretched too far or try to catch a falling knife right in the middle of nowhere. Finding institutional order blocks gives you the patience to wait for price to return to high-interest footprints, letting you enter with tight stop losses and massive risk-to-reward potential.

What Is an Order Block?

An Order Block (OB) is a specific price zone on a chart where major market participants—such as central banks, hedge funds, and institutional desks—placed heavy buy or sell orders.

Because institutional orders are far too massive to fill all at once without breaking market stability, these players leave behind unfilled orders (resting liquidity). When price eventually returns to these exact levels later on, those remaining orders trigger, causing price to violently launch away or ignite a brand-new trend expansion.

Spotting a real order block requires looking for two simple criteria:

  • Bullish Order Block: Look for the last down-close candle right before a powerful, aggressive move up that successfully breaks market structure (BOS) or changes character (CHOCH).

  • Bearish Order Block: Look for the last up-close candle right before a sharp, downward collapse that breaks structure to the downside.

If a candle didn't cause an aggressive move that broke structure and left imbalance behind, ignore it. It isn't a valid order block.

Supply and Demand vs. Basic Support and Resistance

Retail textbooks love drawing simple horizontal lines across random wicks and calling them support or resistance. The problem? Those lines ignore institutional volume.

Supply and Demand zones mark entire price ranges...

Continue reading...
0
0
GFATHER

Mastering Market Structure: The Universal Map Every Trader Needs

Mastering Market Structure: The Universal Map Every Trader Needs

Mastering Market Structure: The Universal Map Every Trader Needs

Every market leaves footprints. It doesn’t matter if you’re looking at a 5-minute crypto chart, tracking Apple stock on the daily, or scanning EURUSD ... during the London open. Price leaves clues everywhere.

The problem? Most traders waste years chasing lagging indicators. They tweak RSI settings, test double moving average crossovers, or wait for Stochastic lines to magically solve the market. It doesn't work. Indicators only summarize what already happened. If you want to know where price is actually heading, you have to read the core engine of price itself: market structure.

Understanding the Core Blueprint

Strip away the indicators, and the market becomes surprisingly simple. Price moves in natural cycles of expansion, contraction, and consolidation. It’s just an endless tug-of-war between buyers and sellers fighting over liquidity.

Across every asset class and timeframe, you’ll see the market rotate through three main states:

  • Uptrends: Price makes higher highs and higher lows. Buyers clearly hold the steering wheel, and dips get bought quickly.

  • Downtrends: Price makes lower highs and lower lows. Sellers dominate the room, breaking support levels while buyers fail to defend pullbacks.

  • Ranges: Price bounces back and forth between obvious floor and ceiling levels. Neither side has control, creating a messy chop where orders pile up on both sides.

If you can identify which state the market is in right now, you instantly avoid the biggest mistake in trading: trying to buy a crashing market or shorting a moonshot.

Identifying the Shift: BOS vs. CHOCH

Once you spot the overall trend, you need to know when it’s healthy and when it’s about to fall apart. This comes down to two key price events.

First, there’s the Break of Structure (BOS). When a market is trending up and punches cleanly past...

Continue reading...
0
0
GFATHER

Mastering Risk Management & Liquidity Sweeps: How Smart Money Controls the Market

Mastering Risk Management & Liquidity Sweeps: How Smart Money Controls the Market

Mastering Risk Management & Liquidity Sweeps: How Smart Money Controls the Market

Ask any seasoned trader what separates consistent professionals from the 90% who lose money, and you will rarely hear about a secret indicator or a perfect entry pattern. The real differentiator comes down to two foundational pillars: understanding institutional liquidity sweeps and executing disciplined risk management.

If you have ever placed a trade, set a tight stop loss right beyond a technical swing high or low, and watched in frustration as price surged just far enough to kick you out before immediately reversing in your predicted direction, you have experienced a liquidity sweep.

Understanding how market makers use retail stop losses to fill their own orders—and structuring your risk parameters around this reality—is the single most important step in protecting your capital and trading with longevity.

The Anatomy of a Liquidity Sweep

To navigate the market effectively, you must understand that price does not move simply because an indicator flashes a signal. Price moves toward areas of high liquidity. Liquidity is simply pool money—a collection of buy and sell orders resting at predictable chart levels.

Retail trading textbooks teach millions of people to place stop-loss orders in the exact same locations:

  • Buy Stop Losses: Placed just above obvious resistance levels, previous day highs, or equal highs.

  • Sell Stop Losses: Placed just below obvious support levels, previous day lows, or equal lows.

Institutional market participants—such as hedge funds, algorithmic trading desks, and bank market makers—operate with orders so large that they cannot enter positions without moving the price against themselves. To fill a massive buy order, an institution needs a massive cluster of sell orders. Where are those sell orders resting? Right below key support levels as retail stop losses.

A liquidity sweep (often called a stop hunt...

Continue reading...
0
0
GFATHER

Mastering Market Structure: The Universal Map Every Trader Needs

Mastering Market Structure: The Universal Map Every Trader Needs

Mastering Market Structure: The Universal Map Every Trader Needs

Every market tells a story.

Whether you are staring at a 5-minute chart of Bitcoin, analyzing the daily candles of Apple stock, or tracking momentum on EURUSD ... , price action leaves distinct clues. Yet, most retail traders spend years chasing lagging indicators—searching for a secret moving average crossover or a magical RSI setting that will guarantee consistent profits.

The cold truth? Indicators only show you what has already happened. They are mathematical derivatives of past price. To understand where price is going next, you must master the fundamental blueprint behind every market: Market Structure.

What Is Market Structure?

At its core, market structure is the universal framework describing how price moves in natural cycles. Markets never move in straight lines indefinitely. They expand, contract, reverse, and consolidate as buyers and sellers continuously compete for liquidity.

Regardless of the asset class or timeframe, market structure consists of three primary phases:

1. Uptrend: Defined by a series of Higher Highs (HH) and Higher Lows (HL). Buyers are aggressively pushing price upward, and sellers are only able to cause minor, temporary pullbacks.

2. Downtrend: Defined by Lower Highs (LH) and Lower Lows (LL). Sellers dominate, systematically breaking key support levels while buyers fail to defend previous swing points.

3. Consolidation (Range): Price is trapped between a clear resistance ceiling and support floor. Neither side has control, creating a neutral environment where institutional liquidity builds up on both sides.

Understanding which phase the market is currently in saves you from making the single most common retail trading error: fighting the macro trend.

The Shift: Spotting the Break of Structure & CHOCH

Trading becomes significantly clearer when you learn to identify a Break of Structure (BOS). A break of structure occurs when price forcefully...

Continue reading...
0
0

Alphabet (GOOGL) Earnings: The Tech Industry’s “Moment of Truth” – Cloud Growth vs. Skyrocketing Capex

Alphabet (GOOGL) Earnings: The Tech Industry’s “Moment of Truth” – Cloud Growth vs. Skyrocketing Capex

The Divergence: Magnificent Seven vs. Semiconductors

A fascinating shift has occurred in the market over the past month. We are seeing a widening performance gap between the "Magnificent Seven" and semiconductor stocks. While chipmakers have been the primary beneficiaries of the AI gold rush, the companies actually paying for those chips — the hyperscalers like Alphabet — have seen their forward free cash flow projections come under intense scrutiny.

Analysts at institutions such as Deutsche Bank are closely watching this divergence. The market is currently undecided whether the circular relationship between semiconductor demand and Big Tech spending is sustainable. If Alphabet reports a strong beat today and raises its Capex guidance, it could act as a catalyst to lift both the Mag 7 and the struggling semi-sector together. However, if the news is lackluster, the "buy the dip" mentality for chips could quickly evaporate.

Cloud Computing: The True Proof of AI Returns

According to Bloomberg AI analysis, the "make or break" metric for Alphabet this afternoon will be Google Cloud. Investors are demanding evidence that the billions of dollars poured into AI infrastructure are yielding a clear return on investment. The projections are ambitious: Google Cloud sales are expected to jump nearly 65 percent from a year ago, reaching approximately $22.4 billion.

This growth is essential because Alphabet’s search business, while still dominant, faces a new era of competition. The focus has shifted to how effectively Google can monetize its AI tools for enterprise clients. In this landscape, the integration of AI into global business processes — often managed through platforms like SAP ... — becomes a key indicator of long-term utility. If Alphabet can beat the 63 percent growth rate seen in the previous quarter, it will give the market confidence that its spending is prudent.

The Capex Arms Race...

Continue reading...
0
0
GFATHER

I Didn’t Need a Better Strategy—I Needed a Better Memory

I Didn’t Need a Better Strategy—I Needed a Better Memory

I still remember staring at my trading history one Friday evening, completely convinced the market had been against me all week. Nothing seemed to work. Every setup looked promising before I entered, yet somehow the result was almost always the same. A small loss here, another loss there, then one good trade that barely covered the damage. I closed my laptop frustrated, telling myself next week would be different.

The strange part was that I had said those exact words the week before.

And the week before that.

At some point I stopped blaming the market long enough to ask a question that made me uncomfortable: What if the charts weren't the real problem?

That question led me to something I had ignored for months—a trading journal.

At first, I hated the idea.

It sounded boring. Writing notes after every trade felt unnecessary because I was convinced I already knew what had happened. If a trade lost, I assumed I had simply been unlucky. If it won, I congratulated myself and moved on. There didn't seem to be much else to learn.

I couldn't have been more wrong.

The first few entries were simple. I wrote down the currency pair, the time I entered, where I placed my stop loss, my target and, most importantly, why I took the trade in the first place. I even added a screenshot before entering and another after closing the position.

Nothing looked remarkable during the first week.

By the end of the month, however, a completely different picture appeared.

The market wasn't repeating the same mistake.

I was.

Almost every losing trade shared something in common. I entered too early. I kept convincing myself that price would respect a level before the market had actually shown any evidence. I wasn't waiting for confirmation....

Continue reading...
0
0

DocMorris on the Rise: How Online Pharmacies Are Conquering Germany

DocMorris on the Rise: How Online Pharmacies Are Conquering Germany

Introduction: Growth That Surprised the Market

Wednesday was a triumphant day for the Swiss online pharmacy and telemedicine group DocMorris 0RRB.L ... . The company’s shares jumped by approximately 7 percent after it published second-quarter results that exceeded expectations. External revenue increased by 15.2 percent in local currency, reaching CHFUSD ... CHF 309.7 million. Reported revenue rose by 16.1 percent to CHF 295.4 million.

What is behind this success? The main driver was Germany, where external revenue from prescription medicines surged by 45.8 percent. Digital services, including TeleClinic and the marketplace business, grew by 80 percent. The active customer base expanded by 1.1 million people, reaching 12.9 million.

In this article, we will examine the key factors driving DocMorris’s growth, assess its prospects, and consider whether the company will be able to reach EBITDA break-even in 2026.

Key Financial Indicators

Revenue Growth of 15.2 Percent

DocMorris’s external revenue increased by 15.2 percent in local currency to CHF 309.7 million. Reported revenue rose by 16.1 percent to CHF 295.4 million. This significant increase exceeded market expectations.

Growth was primarily driven by Germany, where external revenue from prescription medicines surged by 45.8 percent. This represented an acceleration compared with the first quarter, when growth stood at 28.6 percent.

Digital Services Grow by 80 Percent

Digital services, including TeleClinic, retail media, and the marketplace business, grew by 80 percent to CHF 13.9 million. This segment is becoming increasingly important for the company, helping to diversify its sources of revenue.

The expansion of digital services indicates that DocMorris is successfully developing an ecosystem that extends beyond the traditional online pharmacy business.

The Active Customer Base Continues to Grow

DocMorris’s active customer base increased by 1.1 million compared with the previous year, reaching 12.9 million. This growth was supported by a significant influx of new customers purchasing...

Continue reading...
0
0

Fed Chair Warsh’s Testimony, US CPI, and Q2 Bank Earnings Collide With Iran-Driven Oil Risk

Fed Chair Warsh’s Testimony, US CPI, and Q2 Bank Earnings Collide With Iran-Driven Oil Risk

US Markets Weekly  |  13–17 July 2026

Nasdaq 100 29,823.90 (near record highs). USD/CAD 1.4155. USD/CHF 0.8085. Gold $4,111.61 (−2.3% wk). Nat Gas $2.94 (−6.1%). US 10Y 4.56% (+11bps). BTC $64,182 (+4.1%). BNB $576.44. Key events: US CPI Tue 14 Jul · JPM/C/WFC + GS/BAC/MS earnings Tue–Thu · Fed Chair Warsh testimony Thu 16 Jul · Retail Sales + jobless claims Thu.

HIGHEST CONVICTION: Buy Nasdaq 100 on confirmed dips toward 29,200, target 30,700. Q2 bank earnings Tue–Thu are the broadening test. AI-infrastructure uptrend intact. CPI Tuesday is the gate.


Last Week at a Glance · 6–10 July 2026

Nasdaq 100  29,823.90 (+1.6% wk)  near record highs — SK Hynix $26.5B debut + Nvidia + Meta drove AI-capex narrative

BTC  $64,182 (+4.1% wk)  V-shaped recovery from mid-week $57,950 Iran dip — ETF inflows resumed after 10-day outflow streak

US 10Y  4.56% (+11bps)  7-week high — US-Iran strikes fired oil, repriced Fed hike odds to ~64% by year-end

Gold  $4,111.61 (−2.3% wk)  Fed hike bets + dollar strength outweighed haven bid — set for weekly loss despite active conflict

Nat Gas  $2.94 (−6.1% wk)  6-week low — 61 Bcf storage build + Freeport LNG maintenance beginning

USD/CAD  1.4155 (−0.2% wk)  loonie firmed modestly as Brent’s Iran rally offset broad dollar strength

USD/CHF  0.8085 (−0.4% wk)  franc clawed back from 1-year low ~0.8123 on Middle East haven demand

BNB  $576.44 (+2.4% wk)  tracked BTC rebound + new Layer-1 chain announced for HFT and AI-agent use cases


The week of 6–10 July was defined by a fresh US-Iran military exchange that briefly rattled every asset class before markets largely looked through it by Friday. Oil’s Iran-driven spike cut two ways: it lifted Fed rate-hike odds to roughly 64% by year-end, firming the dollar and...

Continue reading...
0
0

Downing Street’s Handover Tests Sterling. ECB September Hike Bets Collide With Iran-Driven Oil. XRP’s CLARITY Act Hearing Ripples Into European Crypto

Downing Street’s Handover Tests Sterling. ECB September Hike Bets Collide With Iran-Driven Oil. XRP’s CLARITY Act Hearing Ripples Into European Crypto

European Markets Weekly  |  13–17 July 2026

EUR/USD 1.1413 (pinned near 1-year lows). GBP/USD 1.3396 (1-year highs). Silver $59.83/oz (−4.5% wk). Brent $71.44 (+5.0% wk). FTSE 100 10,531 (−1.7% wk). German 10Y 3.05% (+10bps). ETH $1,798.74 (+2.7%). DOGE $0.074 (Extreme Fear). Key events: UK Q1 GDP + German ZEW Tue · US CPI Tue · Labour result Fri · CLARITY Act Fri.

HIGHEST CONVICTION: Buy GBP/USD on confirmed dips toward 1.3339, target 1.3589. Structural uptrend intact on BoE hike bets. Friday’s Labour handover is two-way event risk — buy the dip, not the pre-announcement spike.


Last Week at a Glance · 6–10 July 2026

GBP/USD  1.3396 (+0.8% wk)  fresh 1-year highs — BoE hike bets + political risk absorbed

EUR/USD  1.1413 (+0.1% wk)  range 1.1395–1.1459 — near 1-year lows, ECB hike bets vs softer dollar

Brent Crude  $71.44 (+5.0% wk)  best week in a month — US-Iran strikes disrupted Hormuz shipping

Silver  $59.83 (−4.5% wk)  worst week in over a month — Iran oil spike firmed Fed hike odds, dollar

FTSE 100  10,531 (−1.7% wk)  AstraZeneca −6%+ on Wainua failure offset by EasyJet Apollo + Vodafone Niel

German 10Y  3.05% (+10bps)  largest weekly rise in 5 weeks — ECB pricing >30bps further tightening

Ethereum ETH  $1,798.74 (+2.7% wk)  ETF inflows + CLARITY Act positioning

Dogecoin DOGE  $0.074 (−1.2% wk)  Extreme Fear (score 20) — late-week bounce tracked BTC/ETH


The week of 6–10 July was dominated by two forces pulling in opposite directions: a renewed US-Iran military exchange that sent oil sharply higher and revived Fed inflation concerns, and a domestic UK political transition that traders had been progressively pricing in for weeks. GBP/USD was the standout European performer, reaching one-year highs as investors concluded that Starmer’s resignation carried less lasting...

Continue reading...
0
0
Navigation menu
instaforex banner