Bar Pipa
We pay for a post of 10$

Indicies

Chips Rally Around SK Hynix. Iran Hits 85 US-Linked Gulf Sites. Treasury Yields Push Toward a 10-Month High. The Dollar Still Cannot Find Its Footing
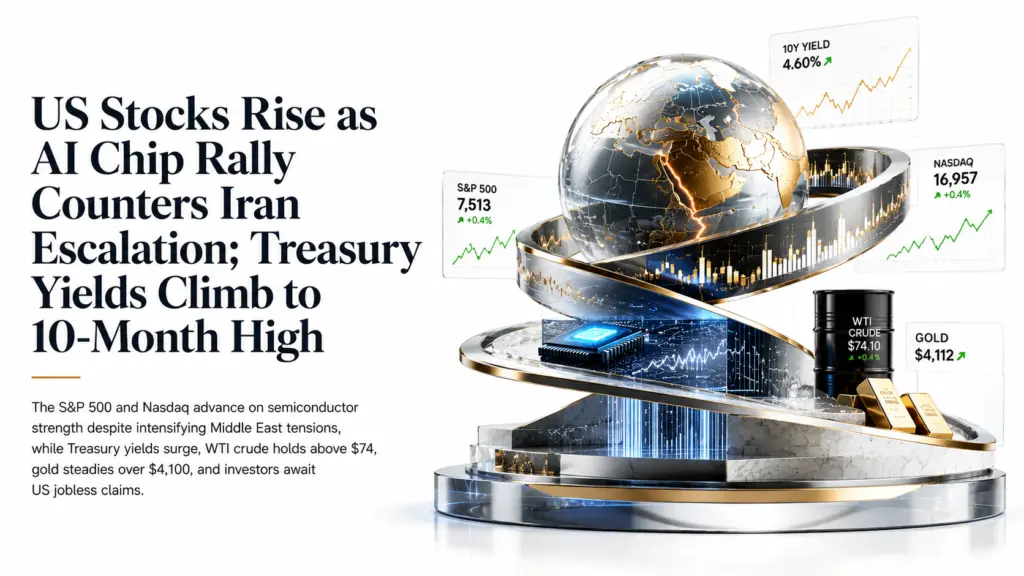
Chips Rally Around SK Hynix. Iran Hits 85 US-Linked Gulf Sites. Treasury Yields Push Toward a 10-Month High. The Dollar Still Cannot Find Its Footing

S&P 500 up 0.4% near 7,513 on SK Hynix US share offering demand and the AI/chip trade. US struck ~90 Iranian targets over two days. Iran retaliated by hitting ~85 US-linked military sites in Bahrain and Kuwait. 10Y Treasury toward 4.60% — 10-month high. 5Y at 4.33%. Fed hike probability for September repriced to ~70%. WTI consolidating near $74 after an 11% two-session surge. Bitcoin stuck at $62,850 with Fear & Greed at 22.

HIGHEST CONVICTION: Fade the US 5-year Treasury yield rise toward 4.40%. The hawkish repricing is oil-shock driven, not demand-driven. Oil shocks are historically less persistent for Fed policy than domestic wage and services inflation.


The Divergence That Defines the Session

Equities are up 0.4%. Bond yields are at 10-month highs. Both things are happening simultaneously and the reason they can is that they are responding to different inputs from the same Iran story. The equity market is buying the chip trade — SK Hynix’s US share offering drew strong demand, and that demand signal is rippling through every AI and semiconductor name on the board. The bond market is buying the inflation argument — the same Iran escalation that is producing the Hormuz risk premium is feeding directly into the rate-hike probability.

The US struck roughly 90 Iranian targets over two sessions. Iran retaliated by hitting approximately 85 US-linked military sites across Bahrain and Kuwait. President Trump declared the ceasefire MoU over. These are not conditions that typically produce equity rallies. The reason stocks are higher is that six of eleven S&P sectors closed positive on Wednesday even as the index fell, evidence that the rotation into chips is powerful enough to run against the macro headwind. Wednesday’s FOMC minutes — the first released under Chair Kevin Warsh — showed policymakers genuinely divided on further...
Continue reading...
0
0

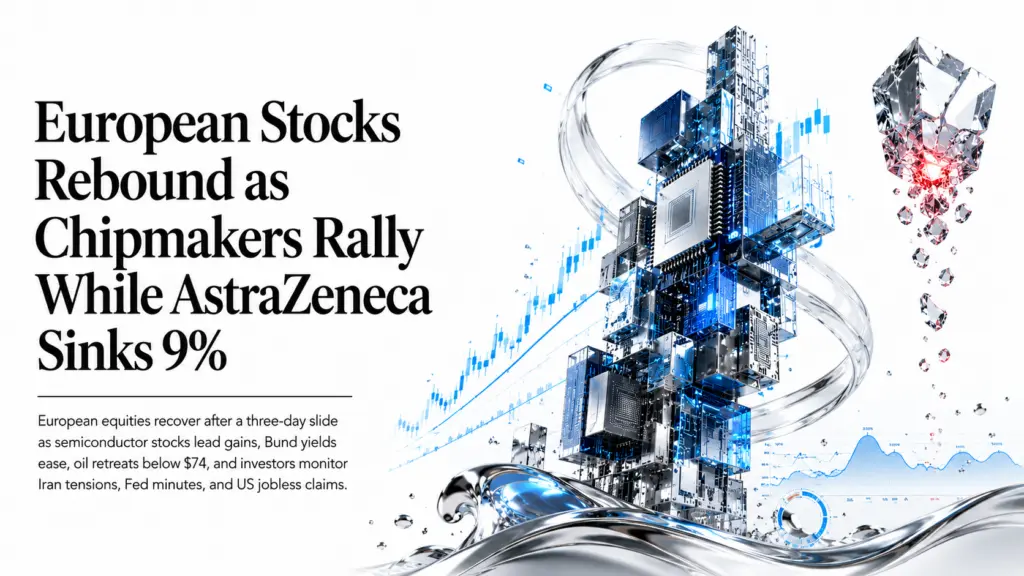
European Stocks Rebound. AstraZeneca Plunges 9%. Bund Yields Ease From a Two-Month High. Oil Retreats. The Dollar Still Cannot Find a Haven Bid

European Stocks Rebound. AstraZeneca Plunges 9%. Bund Yields Ease From a Two-Month High. Oil Retreats. The Dollar Still Cannot Find a Haven Bid

CAC 40 up 0.6%. DAX up 0.7%. ASML +2.6%, Infineon +3.1%, STMicro +3.7%. FTSE 100 in the red: AstraZeneca down over 9%, its worst day since 2017, after Wainua failed a late-stage cardiac trial. Bund 10Y easing to 3.06% from Wednesday’s two-month high of 3.10%. EUR/USD climbing toward 1.1450 — German trade surplus €19.1B (vs €14.5B prior). GBP/USD at a three-week high above 1.3400. Oil retreating nearly 2% to $73.10. Silver bouncing to $59.12 from Wednesday’s $57.22 low. Crypto holding losses: BTC near $62,300, Fear & Greed at 22.

HIGHEST CONVICTION: Fade the EU 5-year Bund yield rise toward 2.90%. The hawkish ECB repricing looks stretched relative to an oil shock that is potentially reversible if Qatar-mediated diplomacy gains traction.


Two Markets Inside One European Session

Thursday’s European session is a cautious rebound built on a fragile premise: that the Iran situation will de-escalate again, just as it did in June. The Stoxx 600 is up around 0.5%, led by semiconductor names — ASML up 2.6%, Infineon up 3.1%, STMicroelectronics up 3.7% — following strong investor demand for SK Hynix’s US share offering. France’s CAC 40 has recovered around 0.6% of Wednesday’s 2.2% slide. Germany’s DAX is up around 0.7%. The broader rally is happening on reports that Qatar is pressing Tehran to honour the existing memorandum of understanding and contain the escalation.

London is the session’s obvious exception. The FTSE 100 is in the red because AstraZeneca, its second-largest constituent, has plunged more than 9% — its steepest one-day fall since 2017 — after its gene-silencing drug Wainua, developed with Ionis Pharmaceuticals, failed a late-stage trial to prevent cardiac complications. One failed drug trial is erasing more index points than three European chipmakers are recovering.

The entire continental rebound rests on the assumption that Qatar’s mediation succeeds. Trump...

Continue reading...
0
0

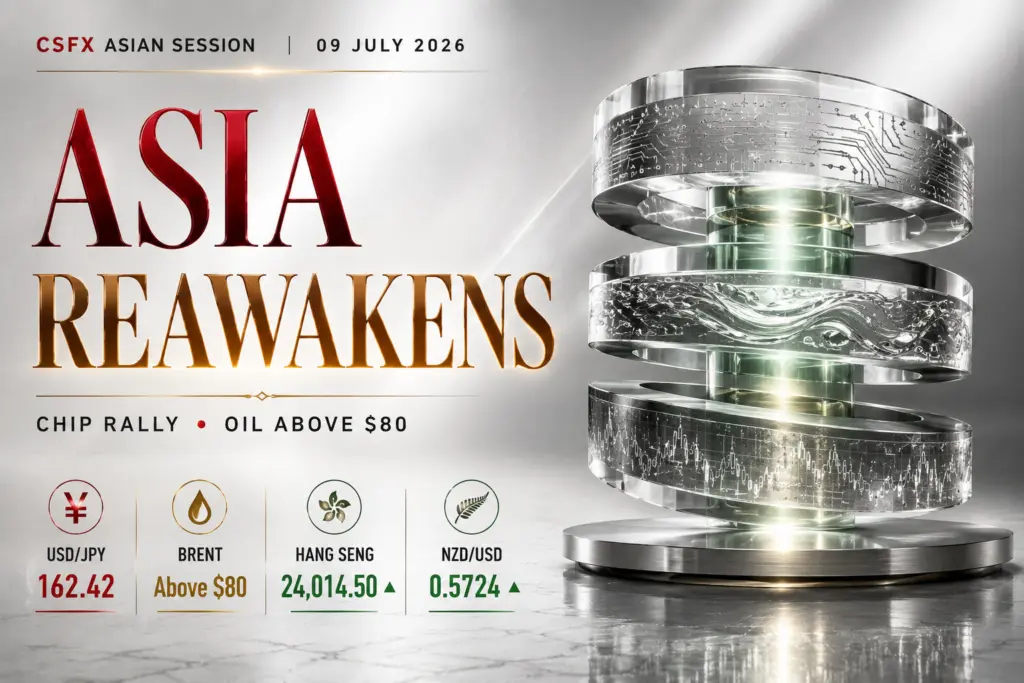
Chips Rebound. Oil Surges for a Third Day. Brent Clears $80. Bonds Are Getting Routed. The RBNZ Just Hiked for the First Time in Three Years

Chips Rebound. Oil Surges for a Third Day. Brent Clears $80. Bonds Are Getting Routed. The RBNZ Just Hiked for the First Time in Three Years

Trump declared the ceasefire MoU “over” and the US struck Iran for a second straight day. Brent is above $80 for the first time since June 22. The 10-year JGB yield is at its highest since September 1996. US Treasuries have added 10 basis points this week. The RBNZ hiked 25bp to 2.50% and signalled more. And Asia’s chipmakers are up 3–7% on a single Nvidia headline. Two completely different markets. Same session.

HIGHEST CONVICTION: USD/JPY is failing to track its own yield support near the 40-year peak. The pair eased 0.2% to 162.42 even as US 10-year yields climbed. Intervention risk and matching JGB yield rises are the explanation. This is a fade, not a chase.


The Oil Story That Is Breaking Bonds

President Trump declared the US-Iran ceasefire memorandum of understanding “over.” The US military launched fresh strikes on Iran for a second consecutive day, this time specifically targeting infrastructure that would help reopen the Strait of Hormuz. Brent crude cleared $80 per barrel for the first time since June 22, up roughly 9% on the week. WTI trades near $74.40. Trump said later he does not expect a return to full-scale war, which capped the initial panic, but the damage to inflation expectations was already done.

Fed funds futures now imply about 38 basis points of policy tightening this year, back to where pricing sat a week ago. Wednesday’s FOMC Minutes showed that a handful of participants already saw a case for raising rates in June before the committee agreed to hold. The oil-driven repricing is pulling Fed expectations back in a hawkish direction at the worst possible time for bond markets.

The 10-year JGB yield just hit its highest level since September 1996. Australia’s 10-year is at its highest since early June. The US 10-year...

Continue reading...
0
0

Rentokil Rises After Goldman Sachs Upgrade

Rentokil Rises After Goldman Sachs Upgrade

Introduction: The Tuesday When the Rats Retreated

Tuesday, London Stock Exchange. Shares of Rentokil Initial PLC, a company known across Britain — from housewives to restaurant owners — unexpectedly came back to life. While the FTSE 100 index remained almost unchanged, Rentokil rose by 2.1%, climbing to 453.5 pence per share. The reason behind the move was an upgrade from Goldman Sachs.

Goldman Sachs, one of the world’s leading investment banks, upgraded Rentokil to “Buy” from “Neutral” and raised its 12-month price target to 590 pence from 515 pence. This implies around 33% upside potential compared with the previous closing price. For investors, this is a signal that the pest control company, which has gone through a difficult period after acquiring Terminix, is finally beginning to recover.

So what has changed? The main factor is improving operating performance in North America, Rentokil’s largest market. After several years of instability related to the integration of Terminix, the company has begun to steadily restore organic growth. Goldman Sachs expects the business to return to mid-single-digit organic growth by 2027, narrowing the performance gap with industry rival Rollins.

The broker also noted that the suspension of the main Terminix integration work reduced operational disruptions, allowing management to focus on improving execution while gradually expanding margins. The group’s EBITA margin is expected to rise to 17.1% in 2027.

Let’s take a closer look at what is really happening with Rentokil, why Goldman Sachs upgraded the stock, and what this means for investors.

What Is Rentokil Initial and Why Does It Matter?

Pest Control and More

Rentokil Initial is not just a company that eliminates rats and cockroaches. It is a global giant in the hygiene and sanitation services sector, operating in dozens of countries around the world. Its services include pest control, workplace hygiene,...

Continue reading...
0
0
Tom Maffin

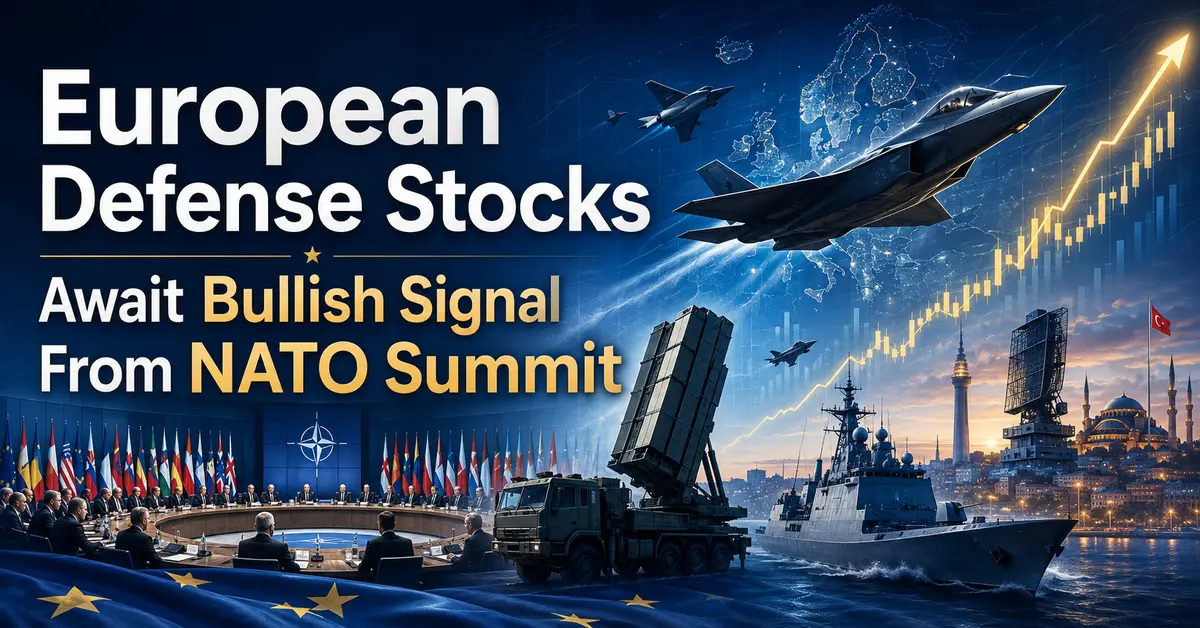
European Defense Stocks Await Bullish Signal From NATO Summit

European Defense Stocks Await Bullish Signal From NATO Summit

Introduction: Ankara Could Change Everything

Tuesday. European defense stocks are frozen in anticipation. Investors are looking at the map and focusing on Ankara — the Turkish capital, where this week’s NATO summit will take place. The two-day event could become the very catalyst Europe’s defense sector has been waiting for.

Goldman Sachs’ basket of European defense stocks has already recovered 17% from its June low, reaching its highest level in more than a month. But this may only be the beginning. If the summit meets expectations, we could see a real rally. If not, the rebound may prove temporary.

What are investors expecting? First of all, clear signals about the future funding of national armies. Donald Trump, who will attend the summit, is likely to increase pressure on European allies, demanding that they raise defense spending to 5% of GDP. This demand, which once seemed unrealistic, may now become reality.

The escalation of the conflict between Russia and Ukraine adds urgency to the issue. The shortage of air defense systems in Kyiv’s arsenal is becoming increasingly obvious, and Ukrainian leader Volodymyr Zelensky is likely to use the summit to call on Western allies for additional weapons supplies.

Morgan Stanley analysts have already called the summit a “key catalyst for European defense.” They expect stronger EU commitments and a repeat of U.S. calls, which would strengthen market confidence in a multi-year cycle and provide an attractive entry point.

Defense stocks have lagged the market this year, gaining only 3.4% amid doubts over how much of the promised spending will actually materialize. The Stoxx 600 index, meanwhile, has risen nearly 10%. But after the summit, the situation could change.

Let’s take a closer look at what is really happening in Europe’s defense sector, what to expect from the NATO summit, and which...

Continue reading...
0
0
BCR

Daily Analysis 7 July 2026 | Fed Outlook Takes Centre Stage as Markets Reassess Rate Expectations

Daily Analysis 7 July 2026 | Fed Outlook Takes Centre Stage as Markets Reassess Rate Expectations

Currency & Commodity Analysis:


US Dollar Index


The US dollar index remained below 101 on Monday, as last week's losses, weaker-than-expected US jobs data, and falling oil prices reduced traders' expectations for a Fed rate hike. Last week's data showed that U.S. nonfarm payrolls increased by only 57,000 in June, the smallest increase in four months and far below the forecast of 110,000, prompting the market to reduce bets on a September rate hike. Oil prices also fell slightly, with the resumption of energy flows in the Strait of Hormuz and the prospect of rising OPEC+ production raising concerns about potential oversupply. This helped alleviate inflationary pressures that had previously supported expectations of further rate hikes. Investors are now awaiting the minutes of the Fed's June policy meeting later this week for new clues about the interest rate outlook.


The dollar index has rebounded to just below 101. The current movement of the dollar index reflects a typical tug-of-war structure between "interest rate expectations support" and "weak economic data." The expectation of a continued tight policy from the Fed provides a bottom support for the dollar, but slowing employment and cooling inflation limit its upside. Overall, the dollar remains in a high-level consolidation structure, with short-term fluctuations mainly driven by the interplay between interest rate expectations and economic data. The dollar index is likely to remain in the 100.00–101.50 range. From a daily chart perspective, the US dollar index is maintaining an upward trend above the 100 level, with the overall trend still within a corrective rebound channel. The index has repeatedly tested and stabilized around 101, indicating some support and divergence between bulls and bears in this area. A break above this level is needed to correct the downward structure of this week; the first target...

Continue reading...
0
0
BCR

Daily Analysis 6 July 2026 | Markets Reprice Fed Outlook After Weak Jobs Data

Daily Analysis 6 July 2026 | Markets Reprice Fed Outlook After Weak Jobs Data

Currency and Commodity Analysis:


US Dollar Index


The dollar index fell below 101 last week, after a sharp drop in the previous trading day, as weaker-than-expected U.S. labor market data lowered traders' expectations for a Federal Reserve rate hike this year. The U.S. economy added only 57,000 jobs in June, the lowest level in four months and well below the forecast of 110,000, while the unemployment rate was 4.2%. This echoed a report on Wednesday showing that private sector job growth also missed expectations. Fed funds futures now imply about a 50% probability of a September rate hike, down from 67% before the latest jobs report. Fed Chairman Kevin Warsh also said this week that inflation expectations are weakening, while reiterating the central bank's commitment to maintaining price stability. The dollar index is expected to end the week at a lower level, ending a two-week winning streak.


The dollar index fell 0.48% last week to close at 100.87, marking its biggest weekly drop since early April and its worst weekly performance in 12 weeks. The employment data aligned with the assessment that "policy will eventually shift and the dollar will weaken," and the dollar is expected to face further downside potential. Notably, the US Treasury market was closed on Friday for the Independence Day holiday, which amplified volatility in the thin trading of the foreign exchange market. Meanwhile, investors are seeking new signals to determine whether the dollar will continue to be under pressure next week. Following Thursday's weaker-than-expected US non-farm payroll report, the dollar is unlikely to enter a sustained downtrend. These data alone are insufficient to trigger a significant repricing of expectations for a Fed rate hike. The dollar index is expected to stabilize within the 100.0-101.500 range in the coming weeks.


Last week,...

Continue reading...
0
0

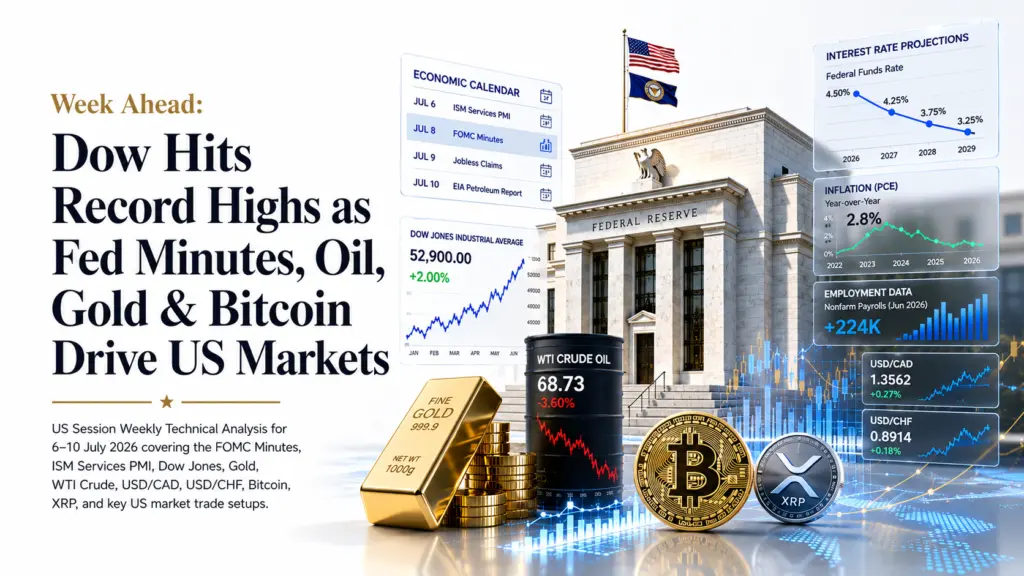
US Session Weekly | 6–10 July 2026 Dow Jones at Record Highs as Oil Slides on Hormuz Reopening, Gold Rebounds on Soft Jobs Data, and Bitcoin Claws Back From Extreme Fear

US Session Weekly | 6–10 July 2026 Dow Jones at Record Highs as Oil Slides on Hormuz Reopening, Gold Rebounds on Soft Jobs Data, and Bitcoin Claws Back From Extreme Fear

USD/CAD 1.4200 (7-month high range). USD/CHF 0.8032 (off 1-yr high 0.8139). Gold $4,174.71 (+2.3%) off $3,972 8-month low. WTI $68.73 (−3.6%) lowest since Feb. Dow record 52,900. US 10Y 4.48% (+6bps). BTC $62,641.86 (+7%) off June’s worst monthly close in 4 years. XRP $1.131 (+8%). FOMC minutes Wednesday.


LEVEL

HEADING INTO THE WEEK

USD/CAD

1.4200


USD/CHF

0.8032


Gold XAU

$4,174.71


WTI Crude

$68.73


Dow Jones

52,900.00


US 10Y Yield

4.48%


Bitcoin BTC

$62,641.86


XRP

$1.131


The holiday-shortened week of 29 June to 3 July turned on a single pivot: Thursday's 57,000 NFP print against a roughly 115,000 forecast, with 74,000 in downward revisions to prior months, cut September Fed hike odds from roughly 64 to 67% to roughly 50%. That data landed against the backdrop of a genuinely hawkish-leaning Fed hold earlier in June, and Warsh's Sintra remark that inflation expectations have come down gave markets room to price a more balanced outlook. The Dow closed at a fresh record 52,900.00, up 2% as capital rotated into blue-chip industrials while AI-linked semiconductor names -- Micron, Applied Materials, AMD, Sandisk -- sold off sharply on valuation concerns. Gold rebounded from an eight-month low as fading hike bets restored its appeal. WTI fell to its lowest since February as Hormuz flows normalised. Bitcoin rebounded 7% off June's worst monthly close in four years. XRP reclaimed $1.10 on a $281 million short squeeze. Wednesday's FOMC minutes are the week's tie-breaker.

FOMC Minutes Wednesday: The Week’s Single Most Important Release

The US 10-year yield at 4.48%, the Dow's record run, gold's rebound, and the broad-dollar bid behind USD/CAD's seven-month high are all suspended between two competing signals. The Fed's June hold left roughly half of FOMC members projecting at least one more 2026 hike...

Continue reading...
0
0

European Session Weekly | 6–10 July 2026 European Stocks Hit Record Highs on a Softer Dollar. A Cautious ECB and Wednesday’s Fed Minutes Set the Tone

EUR/USD 1.1437 (+0.5% wk). GBP/USD 1.3350 (+1.0%). Silver $62.37 (+4.1%). Wheat $5.88/bu (+2.1%). FTSE 100 10,634 (+2.9%) near 52-week high 10,935. Germany 10Y 2.95% (+6bps). ETH $1,753 (−2.9%). LTC $43.15 (+4.5%). ECB Accounts Thursday. FOMC Minutes Wednesday.


LEVEL

HEADING INTO THE WEEK

EUR/USD

1.1437


GBP/USD

1.3350


Silver

$62.37


Wheat CBOT

$5.88/bu


FTSE 100

10,634


Germany 10Y

2.95%


Ethereum ETH

$1,753


Litecoin LTC

$43.15


The week of 29 June to 3 July in the European session turned on Thursday's 57,000 NFP miss against a 115,000 consensus, which cut September Fed hike odds from roughly 67% to roughly 50% and drove a broad dollar retreat. EUR/USD reclaimed $1.14 on dollar weakness, not ECB strength -- Eurozone CPI undershot at 2.8% headline and 2.4% core, and Lagarde at Sintra described inflation and growth risks as more balanced, marking a clear softening from the hawkish June rate hike tone. GBP/USD reached a two-week high on the same dollar move, even as Bailey flagged a slowing economy without signalling imminent cuts. Silver rebounded sharply off seven-month lows. The FTSE 100 surged 2.9%, led by AstraZeneca, GSK, BAE Systems, and Babcock into a defensive-led rotation that insulated London from a global tech selloff. The week of 6 to 10 July asks whether this dollar-driven relief rally extends or fades as ECB Accounts, FOMC minutes, and UK political transition headlines take over.

EUR/USD at 1.1437: The ECB Accounts Are Thursday’s Gate

EUR/USD at 1.1437 sits roughly in the middle of its 2026 trading range -- above June's low of 1.1354 but well below January's high above 1.20. The analytical distinction the article makes explicit: the recovery was driven by broad US dollar weakness, not ECB hawkishness. Wednesday's Eurozone CPI came in below forecast at 2.8% headline and...

Continue reading...
0
0

Asia-Pacific Weekly | 6–10 July 2026 Yen Near Four-Decade Low as Intervention Risk Builds. Hang Seng Rebounds on Fed-Pause Bets. Crypto Extreme Fear Eases

Asia-Pacific Weekly | 6–10 July 2026 Yen Near Four-Decade Low as Intervention Risk Builds. Hang Seng Rebounds on Fed-Pause Bets. Crypto Extreme Fear Eases

USD/JPY 161.85 near 40-year yen low -- MoF may abandon advance signalling. AUD/USD 0.6940 off 3-month lows. Copper $6.11 awaiting binary tariff call. Nat gas $3.17 down 3.9%. Hang Seng 23,416 +3.3%. DOGE $0.0766 off $0.072 shelf. ADA $0.174 +19.2%. Van Rossem hard fork opens 8 July. China CPI Thursday. BOJ Summary of Opinions Tuesday.


LEVEL

HEADING INTO THE WEEK

USD/JPY

161.85


AUD/USD

0.6940


Copper COMEX

$6.11/lb


Nat Gas HH

$3.17/MMBtu


Hang Seng

23,416


Dogecoin DOGE

$0.0766


Cardano ADA

$0.174


The week of 29 June to 3 July was defined by a single pivot: Thursday's 57,000 NFP print against a 115,000 consensus, which cut September Fed hike odds from roughly 67% to roughly 50% and triggered a broad relief rally into the weekend. USD/JPY clawed back from its intraweek 40-year high as Reuters reported Tokyo may abandon advance intervention signalling -- a shift that caused a nearly 1% yen rally on one-sided positioning alone. AUD/USD recovered off three-month lows. The Hang Seng staged its sharpest rebound in months, adding 3.3% to recover from its prior week's worst single session in over a year. Cardano surged 19.2% -- the sharpest move in this report. The week of 6 to 10 July asks whether that Fed-pause relief rally has genuine follow-through, or whether three regional catalysts -- yen intervention risk, a binary copper tariff decision, and China's June inflation data -- reassert more cautious two-way price action.

USD/JPY at 161.85: The Week's Highest Tail Risk

USD/JPY at 161.85 sits within striking distance of the yen's weakest level in roughly forty years. Finance Minister Satsuki Katayama has repeatedly warned that authorities stand ready to respond appropriately at any time. Thursday's sharp, nearly 1% yen rally -- triggered by a Reuters report that Tokyo may...

Continue reading...
0
0
Navigation menu
instaforex banner