Bar Pipa
We pay for a post of 10$

ETF

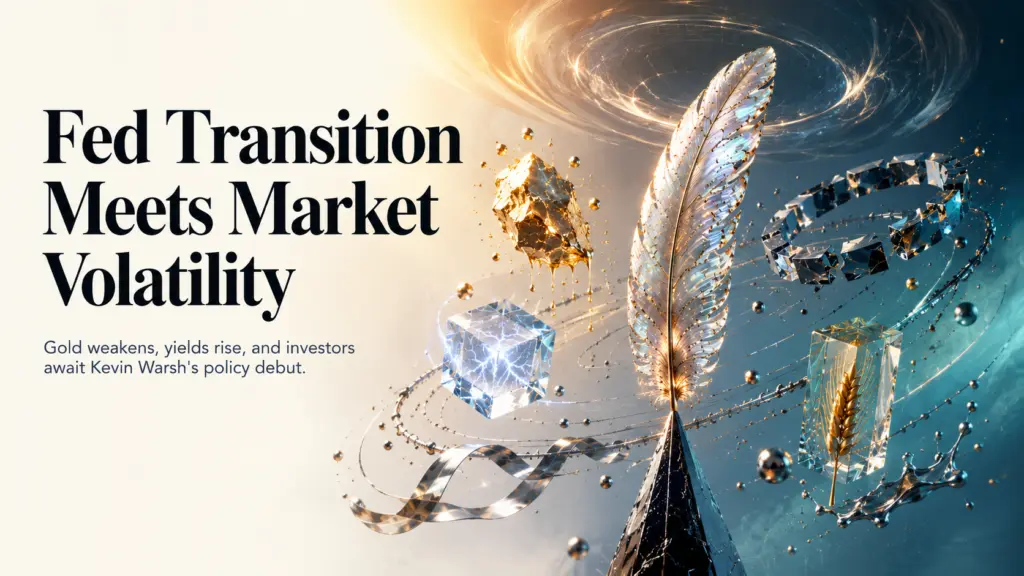
Tomorrow Warsh Speaks. Everything in This Session Is Waiting for That 18 Minutes.
Tomorrow Warsh Speaks. Everything in This Session Is Waiting for That 18 Minutes.

Gold is up for a third straight day. The Nasdaq has just printed its best single session in weeks. Tesla is sliding on SpaceX merger fears. Bitcoin is holding $65,884. And the US 30-year yield is sitting just below 5% — the level that historically makes equity investors very uncomfortable. All of it resolves tomorrow.


The morning before a Fed meeting is one of the quietest and most revealing sessions you will ever trade. Every participant knows the decision is already made. Every analyst has done their FOMC preview. The only thing left is the calibration of risk — how much do you hold into tomorrow, how much do you trim, and where do you have your stops set for the press conference at 18:30 ET? Tuesday's US session is that calibration. And the positions markets have chosen to hold into tomorrow tell a clear story about what traders actually believe will happen.

Gold at $4,324.6 is up for a third consecutive session. That is not an accident. Gold going up into a Fed meeting means the bond market is telling you that the dovish scenario — the one where Warsh acknowledges that falling energy prices from the Iran peace deal have changed the inflation calculus — is the one being given incremental probability. The 30-year Treasury yield hovering just below 5% at 4.98% is the counterweight: someone is still pricing in the possibility that Warsh surprises hawkishly and that the long end has more repricing to do.

Gold rising three days in a row into a Fed meeting is the bond market's way of saying: we think Warsh blinks first.

The Two Stories That Got Us Here

The Iran peace deal announcement last week did something to asset prices that took a few days to fully absorb. It...
Continue reading...
0
0

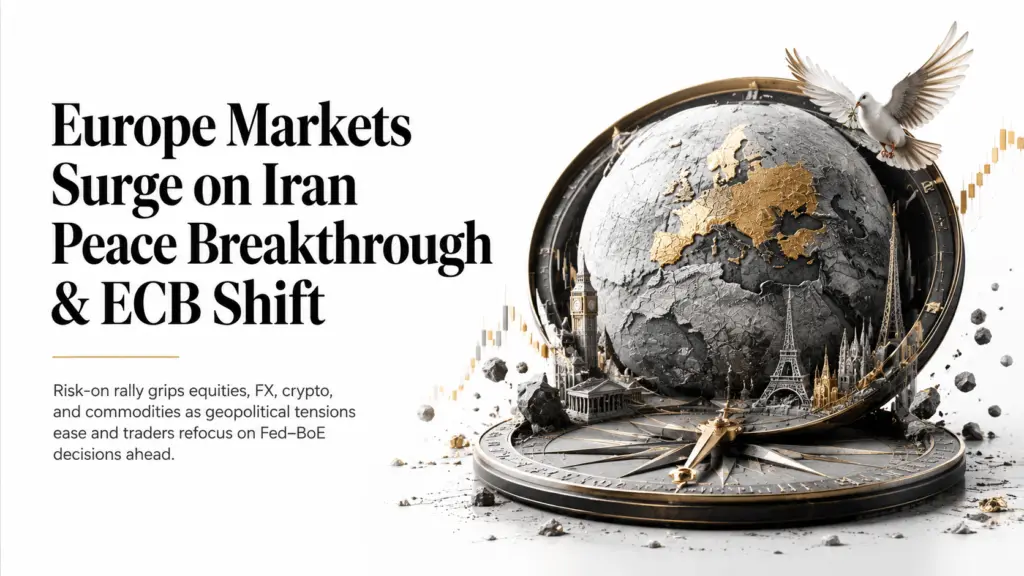
The ECB Hiked. The Iran Deal Crushed Oil. And Europe Is One Press Conference Away From Its Next Big Move.

The ECB Hiked. The Iran Deal Crushed Oil. And Europe Is One Press Conference Away From Its Next Big Move.

EUR/USD is at 1.1609 — its highest since early June. Brent has crashed to $81.94, a two-month low. The CAC 40 is 2% from an all-time record. And tomorrow, Kevin Warsh tells the world whether the ECB-Fed divergence trade lives or dies.

Capital Street FX Research Desk  ·  16 June 2026

Two things happened to Europe in the last five days that are supposed to pull in opposite directions — and right now they are both pushing the same way. The ECB raised rates last Thursday for the first time since 2023, hiking 25 basis points to 2.25% and upgrading its inflation forecast to 3.0% for 2026. Normally, a rate hike against a backdrop of weak growth is the kind of stagflationary signal that sends equities lower and yields higher while the currency struggles. Instead, EUR/USD is at 1.1609. The CAC 40 is near 8,447 — 2% from its record high. Brent has cratered to $81.94. Long-end Bund yields are easing. And copper is sitting just below record territory. The reason all of this is happening simultaneously is Iran.

The US-Iran peace deal — with a formal signing ceremony scheduled for Friday in Bern — has crashed the oil price by removing the war premium that had been embedded in energy since February. Lower oil means lower inflation in the near term, which means the ECB's forecast of 3.0% may prove too high, which means money markets have already pulled back their pricing from two more hikes to one. The hike was designed to fight war-driven inflation — and the war is ending just as the hike lands. This is not a story about policy error. It is a story about sequence: the ECB moved at exactly the right moment to establish credibility, and the peace deal is now arriving...

Continue reading...
0
0

Japan Just Did It — 1% Rates for the First Time Since 1995, and the Yen Still Didn’t Move

Japan Just Did It — 1% Rates for the First Time Since 1995, and the Yen Still Didn’t Move

The BoJ delivered the hike every trader expected. Then it softened the forward guidance — and gave the market an excuse to keep selling yen. This is what happens when you telegraph a move for too long.

Capital Street FX Research Desk  ·  16 June 2026

The Bank of Japan hiked its policy rate 25 basis points to 1.00% today — the first time Japan has held rates at this level since 1995. That is not a trivial number. Thirty-one years. Two lost decades. Four deflation cycles. A generation of traders who have never seen Japan do anything but hold or cut. And yet, in the immediate aftermath of the decision, USD/JPY barely moved. It ticked up, not down. Which tells you something important about what actually drives currency markets: not the decision everyone knows is coming, but the words that come after it.

Governor Ueda delivered the hike — then attached a notably dovish element. The BoJ will pause its Japanese government bond tapering schedule from April 2027. That single sentence told the market that this is a careful, deliberate central bank that is not in a hurry to do the next thing. And in a world where traders had already priced in the 1% hike weeks ago, 'not in a hurry' is interpreted as: stay long dollars, stay short yen. The yen remains weak. USD/JPY firmed above 159.75 in the aftermath.

Japan hiked for the first time since 1995. And the yen went down. That's what happens when a move is telegraphed for six weeks.

What the BoJ Hike Actually Means — Beyond the Headline

Here is the part that matters more than the rate decision itself. The BoJ hiked into a specific economic context: Japan's wholesale inflation is running at 6.3% year-on-year, driven almost entirely by the...

Continue reading...
0
0

US MARKETS WEEKLY · 16–20 JUNE 2026 The New Fed Chair Inherits the Hottest Inflation in Two Years — and Markets Are Holding Their Breath

US MARKETS WEEKLY · 16–20 JUNE 2026 The New Fed Chair Inherits the Hottest Inflation in Two Years — and Markets Are Holding Their Breath

Gold just broke below a level it hasn't seen since 2023. Bitcoin hasn't moved in weeks. And a man who has never run a Fed meeting is about to chair the most consequential FOMC of the year — days after inflation printed at its highest since April 2023.


Capital Street FX Research Desk  ·  13 June 2026


What does a brand-new Fed Chair do when the first inflation data he inherits comes in at 4.2% — the hottest since April 2023 — and his predecessor's policy is already being questioned? Does he hold and signal patience, hoping the market reads it as steady-handed? Does he hold but warn that the door is open to something more? Or does he do what no Fed Chair has done since 2023 and actually hike? Wednesday's FOMC is not a routine meeting. It is Kevin Warsh's credibility test — and every major asset in this weekly is positioned around which version of him shows up. Gold is already below its 200-day moving average for the first time since October 2023. Bitcoin hasn't moved meaningfully in weeks. Treasury yields are within 12 basis points of a 52-week high. The market has made its bet. Now it waits to find out if it was right.

How We Got Here

The story of this week begins on June 10, when the Bureau of Labor Statistics confirmed what traders had been dreading: May CPI came in at 4.2% year-on-year, the hottest reading since April 2023. A few days earlier, May PPI had printed at +6.5% year-on-year — the highest since November 2022. Both prints reflect the same underlying source: the energy shock flowing from Middle East disruption to the Strait of Hormuz, which has been embedding itself into the price level month by month since the...

Continue reading...
0
0

EUROPEAN MARKETS WEEKLY REPORT · WEEK OF 16–20 JUNE 2026 The ECB Just Ended Three Years of Silence — And Silver Paid the Price

EUROPEAN MARKETS WEEKLY REPORT · WEEK OF 16–20 JUNE 2026 The ECB Just Ended Three Years of Silence — And Silver Paid the Price

European Markets Weekly — 16–20 June 2026. One week. A historic ECB rate hike. An Iran peace deal that wiped 4% off silver in a single session. A FTSE 100 closing in on its all-time record. And GBP/USD quietly setting up for what could be its most important move of 2026.


Capital Street FX Research Desk  ·  13 June 2026


What happens when the world's most cautious central bank finally blinks — and does it on the same afternoon a president cancels airstrikes and hints at a peace deal? What does that do to silver, which had been riding three months of war premium straight to the moon? And if the ECB is now hiking while the Bank of England is frozen in place, what exactly is holding up the British pound right now? These are not hypothetical questions. They are the exact trades that played out last week — violently, in real time — and they are the reason GBP/USD looks vulnerable toward 1.36, why Bund yields are building toward 3.20%, why silver’s next level down is $61.50, and why the FTSE 100 — sitting just 4% below its all-time record — may finally have the catalyst it has been waiting for.

Thursday Changed Everything

Let's set the scene. It is Thursday, June 11. The ECB — which has not raised interest rates since 2023 — delivers a 25 basis-point hike to 2.25%. The room expected the hike. What they did not expect was Christine Lagarde keeping the door open for September. She upgraded the ECB's inflation forecast to 3.0% for 2026. She talked about energy. She left every option on the table. German Bund yields shot toward 3.07%. The euro held firm.

Four hours later, Donald Trump posted on social media that he had called off...

Continue reading...
0
0

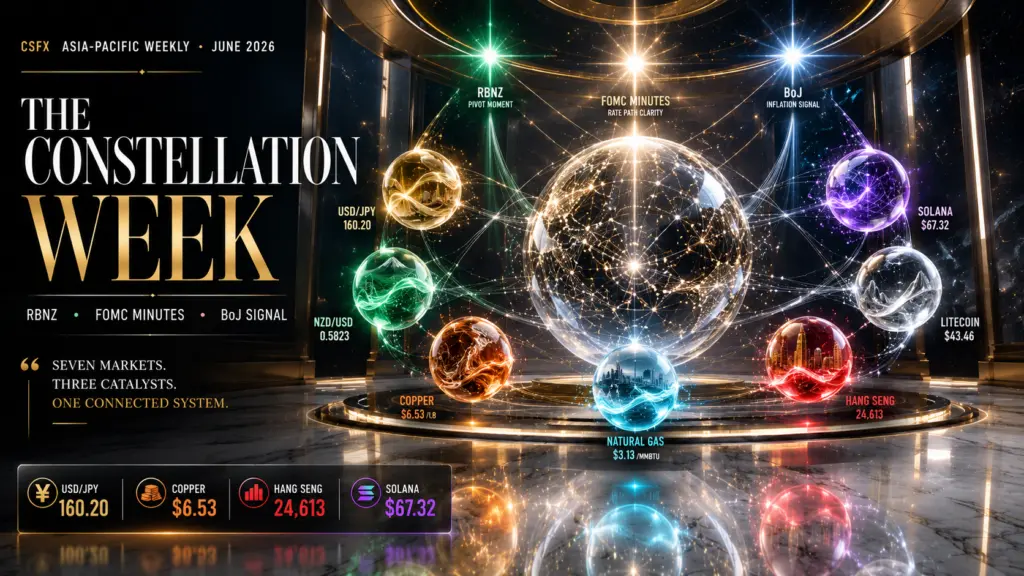
USD/JPY Returns to 160.20, Copper Surges to $6.53 & Hang Seng Retraces to 24,613

USD/JPY Returns to 160.20, Copper Surges to $6.53 & Hang Seng Retraces to 24,613

Saturday, 13 June 2026  ·  Capital Street FX Research Desk

USD/JPY 160.20  ·  NZD/USD 0.5823  ·  Copper $6.53  ·  Nat Gas $3.13  ·  Hang Seng 24,613.3  ·  SOL $67.32  ·  LTC $43.46

Past Week in Review — 9–13 June 2026

The week of 9–13 June 2026 pivoted dramatically on geopolitics. President Trump's remarks on Thursday that a US-Iran peace deal could be signed as soon as this weekend in Europe triggered an aggressive risk-on move across all Asia-Pacific assets. The Hang Seng's 1,946-point weekly surge — from a four-session losing streak low to a 26,626 high — was the most decisive single-week move since March 2025, led by SMIC up 8.4% and Tencent up 4.2%. USD/JPY touched a fresh multi-year high of 160.57 on Thursday — its weakest level since July 2024 — before retreating to 160.20 as the yen climbed 0.6% on the ceasefire remarks. Natural gas shed its Middle East supply risk premium, falling 4.35% on the week as LNG cargo competition eased. Copper recovered sharply to $6.53, well above the $6.20 support, as Jefferies' structural upgrade — forecasting an average 491,000-ton annual supply deficit through 2030 — attracted dip-buying. Solana recovered 11.73% from the $58 structural support zone driven by the Alpenglow consensus protocol upgrade and $15.6 million in spot ETF inflows. Litecoin stabilised within the $40 to $44 demand zone with initial bottom-building capital inflows.


This Week at a Glance — 16–20 June 2026

The week of 16–20 June 2026 is defined by a sequential central bank event structure with direct implications for every instrument in CSFX's Asia coverage. The RBNZ's hawkish pivot last week — signalling rates could rise earlier and by a larger-than-expected margin — has created a structural NZD floor at 0.5800. Wednesday's FOMC minutes are the primary USD direction setter: hawkish...

Continue reading...
0
0

Iran Peace Breakthrough Sparks a Risk-On Rally as ECB & CPI Clear

Iran Peace Breakthrough Sparks a Risk-On Rally as ECB & CPI Clear

Friday, 12 June 2026  ·  Capital Street FX Research Desk

EUR/USD 1.1579  ·  GBP/USD 1.3415  ·  DAX 24,668  ·  Silver $67.02  ·  Nat Gas $3.05  ·  BP 545p  ·  Bund 20Y 3.42%  ·  ETH $1,674  ·  LINK $7.89  ·  BTC $63,577

Session Overview

Europe opens Friday in full relief mode. Overnight President Trump called off fresh strikes on Iran and pointed to a breakthrough in talks to end the war — the firmest de-escalation signal in months — and with this week's two macro hurdles now cleared (the hot-but-soft-core US May CPI and the ECB's 25 basis-point hike to 2.25%), the continent is trading a clean risk-on rotation rather than a war-and-policy binary.

The pivot is sharp and broad. The Stoxx 600 is up about 1.7%, led by the most war-sensitive corners of the market: travel and leisure surged more than 4.9% — TUI +8.5%, Ryanair +7.5%, Lufthansa +6.9% — while European banks added 3.7% as the curve and the rate outlook firmed. The mirror image is energy: with crude sliding on the peace signal, oil majors and the wider energy complex are the session's clear laggards, dragging on the FTSE 100 and on names like BP even as the broad tape rips higher.

The ECB hiked to 2.25% on Thursday — its first move since 2023 — and turned hawkish, lifting 2026 headline inflation forecasts to 3.0% and pricing roughly a 50% chance of a follow-up in September, even as it trimmed growth to 0.8%. The euro sold the fact, with EUR/USD slipping toward 1.1579 near its lowest since early April, as a firm dollar and a draining haven bid outweighed the rate-gap story. Attention now jumps to next week's back-to-back central-bank events: the Fed on June 17 — Kevin Warsh's debut meeting as Chair, expected to hold at...

Continue reading...
0
0

Iran Peace Deal ‘Largely Negotiated’ Sends Oil Crashing & Risk Soaring as BoJ Hike Week Begins

Iran Peace Deal ‘Largely Negotiated’ Sends Oil Crashing & Risk Soaring as BoJ Hike Week Begins

Friday, 12 June 2026  ·  Capital Street FX Research Desk

USD/JPY 160.29  ·  AUD/USD 0.7031  ·  Hang Seng 24,702.6  ·  Copper $6.40  ·  WTI $86.30  ·  BTC $63,427.90  ·  DOGE $0.0860  ·  LTC $42.00  ·  Gold $4,205

Session Overview

Asia wakes up to the sharpest sentiment reversal of the month. Late Thursday, President Trump posted that a peace agreement with Iran — one that would reopen the Strait of Hormuz and end the three-month conflict — is largely negotiated and will be announced shortly, with a memorandum of understanding awaiting final sign-off from Washington and Tehran. The market reaction was immediate and violent: crude oil cratered roughly 4% to its lowest level since mid-May near $86.30, ripping the geopolitical war premium out of the energy complex overnight and triggering a broad risk-on rotation into equities, industrial metals, and crypto just as the region heads into the year's most consequential central-bank week.

The reaction across the region is a clean, one-directional risk rally — almost the mirror image of the past month's war-driven defensiveness. Hong Kong's Hang Seng is firmer near 24,702.6 as oil-import-sensitive Asian equities cheer the prospect of a durable de-escalation, while Japan's Nikkei extends its advance with exporters tracking a still-weak yen. USD/JPY is pinned at 160.29, effectively glued to the intervention line even as the broader risk tape turns constructive — the Iran de-escalation removes one inflationary leg (energy) just days before a Bank of Japan that was already leaning hawkish on a separate leg (wholesale prices at 6.3%). Copper has rebounded sharply off three-week lows toward $6.40 per pound as the growth-friendly headline outweighs the loss of its modest oil-linked cost-push support, while gold holds a haven bid near $4,205 — a sign the de-escalation is being read as real but not yet done.

The crypto...

Continue reading...
0
0
Tom Maffin

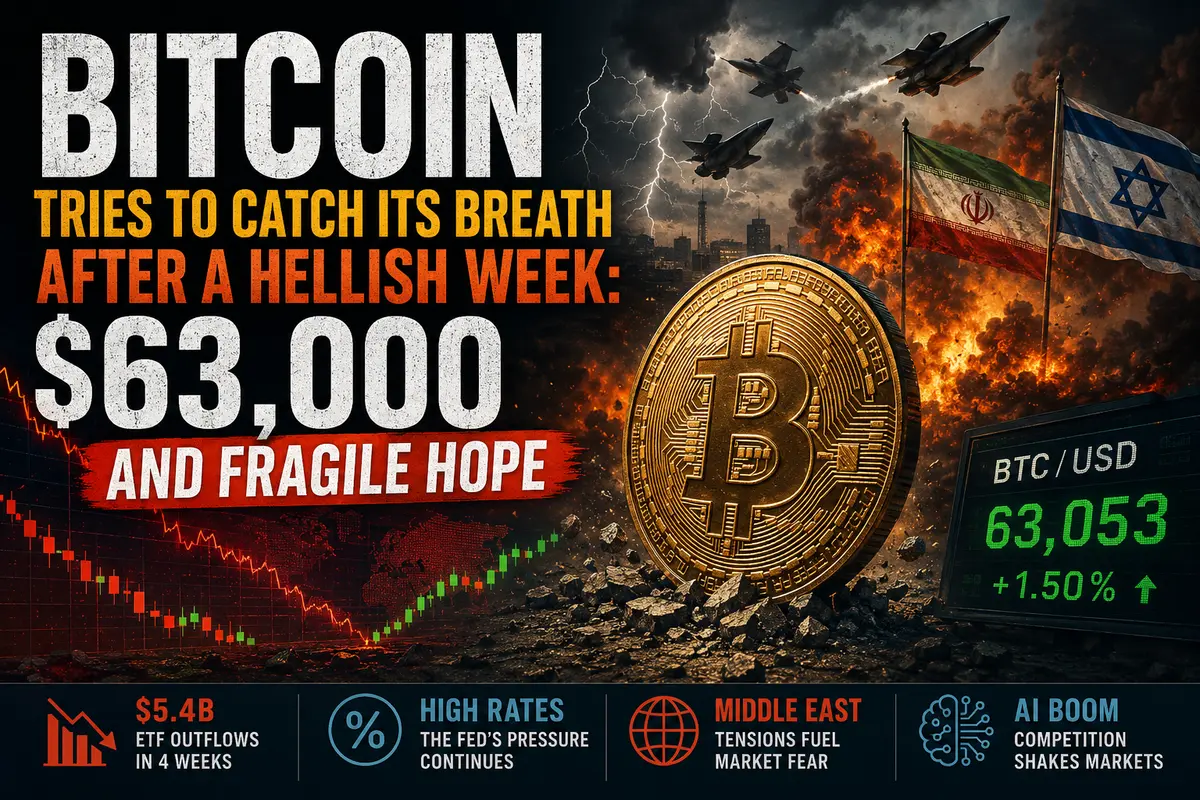
Bitcoin Tries to Catch Its Breath After a Hellish Week: $63,000 and Fragile Hope

Bitcoin Tries to Catch Its Breath After a Hellish Week: $63,000 and Fragile Hope

Monday: A Hint of Green Through the Red Haze

After seven days of nonstop nightmare, after the cryptocurrency market lost nearly $400 billion in market capitalization, after $7 billion in liquidations and panic not seen since the collapse of FTX, Monday finally arrived. It did not bring relief, but at least it offered a brief pause.

Bitcoin rose by 1.5%, reaching $63,053.

Sounds insignificant? Perhaps. After an 18% decline in a single week, one and a half percent is just a drop in the ocean. But in the crypto world, where fortunes are made and lost in a matter of hours, any green candle feels like a gift from fate.

Yet the optimism is cautious, tinged with anxiety about both the past and the future. The fundamental problems that triggered the selloff have not disappeared. Institutional investors continue pulling money out of spot Bitcoin ETFs. The conflict between Iran and Israel has not been resolved—it has merely frozen under a fragile ceasefire that could collapse at any moment. And the Federal Reserve continues to rattle markets with the prospect of persistently high interest rates.

Still, Bitcoin is up 1.5%.

The cryptocurrency managed to hold above the psychologically important $60,000 level, which it briefly fell below on Friday. Altcoins are showing signs of life as well: Ether gained 3.4%, while Solana and XRP each rose 1.3%. Even memecoins, which typically suffer the most during panic-driven selloffs, posted modest gains.

The market is trying to find a bottom.

The only question is whether it has actually found one—or whether this is simply another pause on the way down.

Institutional Exodus: $5.4 Billion Gone in Four Weeks

The biggest story of the past month is not missiles in the Middle East or even Federal Reserve policy.

The biggest story is spot Bitcoin ETFs.

...

Continue reading...
0
0
Lin Brings

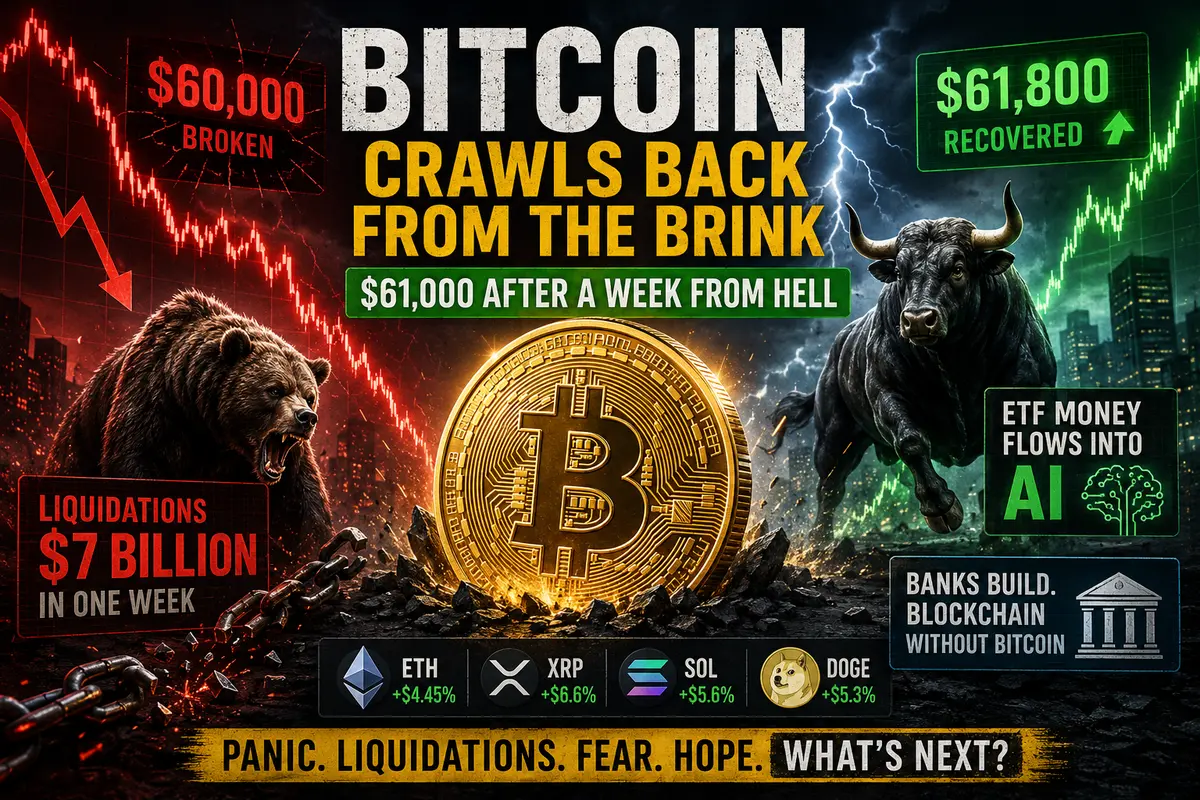
Bitcoin Crawls Back from the Brink: $61,000 After a Week from Hell

Bitcoin Crawls Back from the Brink: $61,000 After a Week from Hell

Friday’s Nightmare: When $60,000 Stopped Being Support

On Sunday morning, the crypto community finally exhaled. Not loudly, not joyfully—the kind of exhale that comes after narrowly surviving a disaster. Bitcoin climbed back above $61,000, gaining 1.7% in just a few hours. On a normal day, that wouldn’t even make headlines. But this was no normal week. It was the most brutal week since the collapse of FTX and the imprisonment of Sam Bankman-Fried.

Let’s start with the numbers to grasp the scale of the damage. Bitcoin lost more than 17% over the week. Ethereum fell around 20%. The entire crypto market shed roughly $390 billion in market capitalization. Three hundred ninety billion dollars—more than the GDP of New Zealand or Portugal—vanished in just five days.

Friday was the real horror show. Bitcoin briefly dropped below $60,000. This wasn’t just another price level; it was a psychological wall. When Bitcoin broke above it, everyone was shouting, “To the moon! $100,000 next!” When it fell below, panic took over. If $60,000 couldn’t hold, where was the bottom? $50,000? $45,000? Nobody knew. Nobody wanted to find out. Everyone simply sold.

And now, on Sunday, traders stare at the chart in disbelief. Bitcoin is back around $61,800. It should be a reason to celebrate. Yet the optimism feels nervous, cautious. What if another crash comes tomorrow? What if this is just a dead-cat bounce?

Strategy Sold Bitcoin. Is That a Sign?

Do you know what triggered the panic for many investors? Not macroeconomic news, not Federal Reserve comments, not even the stock market decline. It was news from a company called Strategy.

Formerly known as MicroStrategy, the company rebranded after Bitcoin effectively became its sole reason for existence.

Strategy spent decades building business intelligence software. Then founder Michael Saylor discovered Bitcoin and became obsessed....

Continue reading...
0
0
Navigation menu
instaforex banner