
Standard Deviation Projections & Institutional Price Targets: Precision Exit Strategies
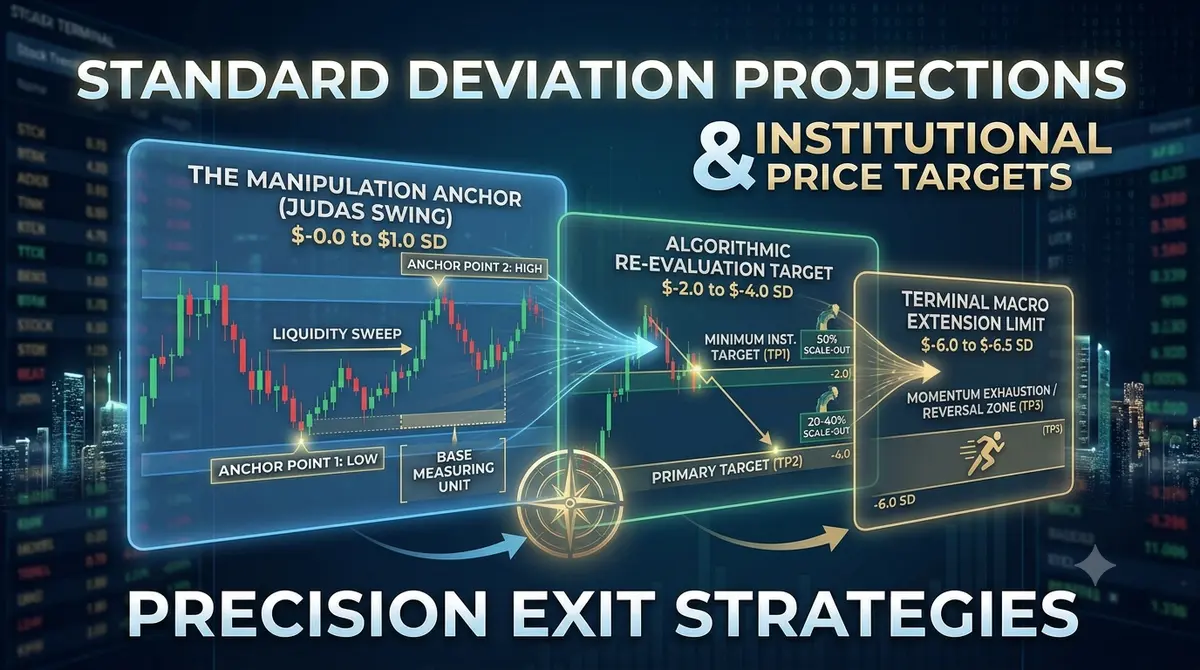
Standard Deviation Projections & Institutional Price Targets: Precision Exit Strategies
You can master top-down analysis, pinpoint pristine order blocks, and trade alongside IPDA cycles, but if you don’t know where to take profits, you are leaving your equity curve to chance.
Holding a winning position too long out of greed often turns a pristine 1:5 Risk-to-Reward trade into a frustrating break-even stopout. Conversely, closing your trade too early out of fear caps your account growth and ruins your statistical edge.
Professional traders use Standard Deviation Projections derived from liquidity sweeps and manipulation legs (Judas Swings) to project exact mathematical targets where institutional algorithms are programmed to take profits and rebalance inventory.
Understanding the Anchor Leg: The Judas Swing
Standard Deviation projections are only as accurate as the anchor leg you measure. You do not place Fibonacci expansions randomly on any swing; you anchor them directly to the manipulation leg (the liquidity sweep).
+---------------------------------------------------------------------------------+
|                       THE MANIPULATION ANCHOR LEG                               |
|                                                                                 |
|                        (Higher High / Sweep Wick)                               |
|                                   /                                            |
|                                  /                                             |
|                                 /                                              |
|  [ Anchor Point 1: Low ] ----->/                                               |
|                               /                                                |
|                              /           <--- [ Anchor Point 2: High ]         |
|                             /                                                  |
|                            /               <--- Explosive Expansion Out        |
|                           V                                                     |
|                                                                                 |
|  =============================================================================  |
|  Standard Deviation Expansion Targets derived from measuring Point 1 to Point 2 |
|  =============================================================================  |
+---------------------------------------------------------------------------------+
What Defines a Valid Anchor Leg?
-
The Sweep: Price drives past an established high or low (such as the Asian session high/low or previous day’s extreme) into a higher-timeframe Point of Interest.
-
The Shift: Immediately after sweeping liquidity, price violently reverses, creating a lower-timeframe Change of Character (CHOCH).
-
The Measurement Box: The distance from the absolute low of the sweep to the absolute high of the displacement leg forms your base measuring unit ($1.0$ Standard Deviation).
Setting Up Your Standard Deviation Fibonacci Tool
To map algorithmic delivery targets, adjust your standard Fibonacci Extension tool to highlight institutional expansion levels.
Tool Settings:
-
$0.0$ to $1.0$: The Manipulation Range (The Anchor Leg)
-
$-2.0$ to $-2.5$: Minimum Institutional Target (TP1)
-
$-4.0$: Key Algorithmic Profit-Taking Target (TP2)
-
$-6.0$ to $-6.5$: Maximum Macro Extension Limit (TP3 / Terminal Expansion)
+---------------------------------------------------------------------------------+
|                    STANDARD DEVIATION EXPANSION MATRIX                          |
|                                                                                 |
|  Level           Institutional Target Significance                              |
|  -----           ---------------------------------                              |
|  -2.0 to -2.5    Initial Bank Take-Profit Zone (High Probability / Scale TP1)   |
|  -4.0            Full Algorithmic Re-evaluation Target (Primary TP2)            |
|  -6.0 to -6.5    Terminal Macro Expansion Limit (Reversal / Exhaustion Zone)    |
+---------------------------------------------------------------------------------+
Executing the Multi-Stage Take-Profit Model
Rather than trying to guess the absolute top or bottom of a move, use standard deviation levels to scale out systematically:
-
Target 1 ($-2.0$ to $-2.5$ SD):
-
When price reaches $-2.0$ standard deviations of the manipulation leg, secure 50% of your position and move your stop loss to break-even or behind the most recent structural swing point. This locks in guaranteed profit and makes the trade completely risk-free.
-
-
Target 2 ($-4.0$ SD):
-
The $-4.0$ level represents the standard mathematical profit target for institutional algorithms. Scale out another 30% to 40% of your initial lot size here.
-
-
Target 3 ($-6.0$ to $-6.5$ SD):
-
Leave a small “runner” position (10% to 20%) to target the $-6.0$ expansion level. This level frequently marks total momentum exhaustion, often signaling a deep market pullback or trend reversal.
-
Confluence with Structural Liquidity
Standard Deviation projections should never be used in a vacuum. The most explosive setups occur when a standard deviation level lands on top of a structural chart feature:
-
SD Target + Unmitigated Fair Value Gap: If your $-2.5$ SD target sits inside a 4-Hour unmitigated FVG, that level becomes a high-conviction exit point.
-
SD Target + Equal Highs / Lows: If your $-4.0$ SD target lines up directly above a pool of retail Equal Highs, the algorithm will drive through those highs to hit both the liquidity and the math target simultaneously.
The Objective Exit Checklist
-
Measure the Trap: Always anchor your SD tool to the manipulation sweep leg, not the corrective pullback.
-
Scale systematically: Don’t let greed stop you from taking partial profits at $-2.0$ SD.
-
Respect Exhaustion: If price reaches $-6.0$ to $-6.5$ SD, do not look for continuation trades in that direction; expect a deep mean-reversion move.

Comments
No comments yet. Be the first to share your thoughts!
Authentication Required
You must be logged in to post a comment.