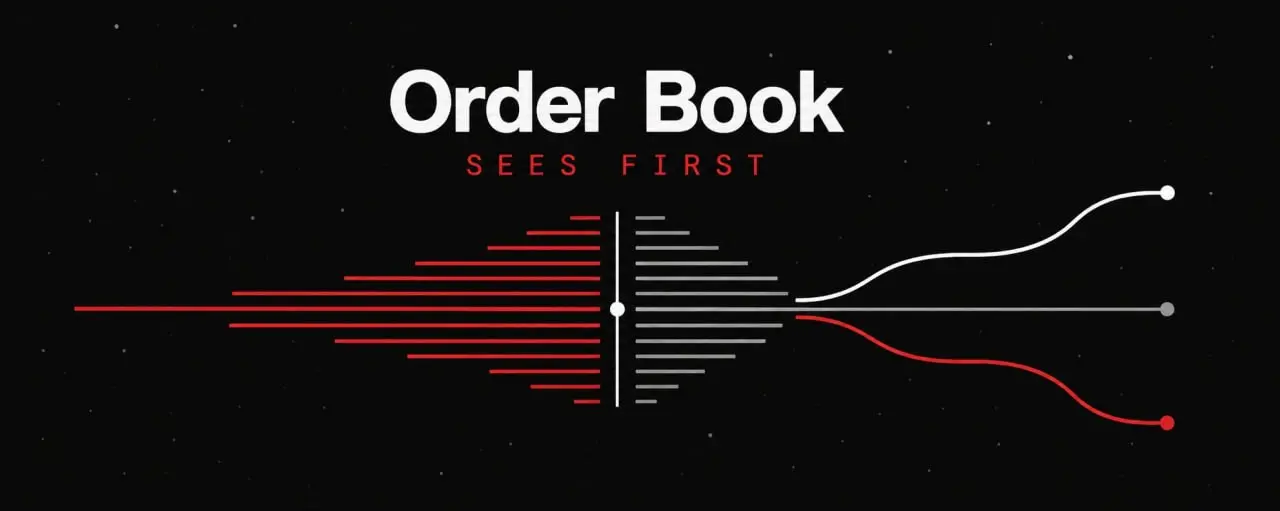
Bar Pipa
We pay for a post of 10$

Crypto

Nikkei Crashes 4%, Yen Hits 160 & Kioxia Implodes

Nikkei Crashes 4%, Yen Hits 160 & Kioxia Implodes

Monday, 8 June 2026  ·  Tokyo / Sydney Open  

★  SOX -10.26% Friday  ·  USD/JPY 160.34 — BoJ Intervention Zone  ·  Japan Q1 GDP +0.5% Beat  ·  Kioxia -11%  ★

AUD/JPY 113.09  ·  USD/JPY 160.34  ·  Copper $6.30/lb  ·  Nat Gas $3.166  ·  ASX 200 8,522.2  ·  XRP $1.11  ·  Cardano $0.16

Session Prices — Tokyo / Sydney Open, 8 June 2026

Nikkei 225 at 63,791 (▼ -4.20%). ASX 200 at 8,522.2 (▼ -0.49%). USD/JPY at 160.34 (▲ +0.06%). AUD/JPY at 113.09 (▼ -0.34%). Copper HG at $6.30/lb (▼ -0.31%). Natural Gas at $3.166/MMBtu (▼ -1.24%). XRP at $1.11 (▲ +2.63%). Cardano ADA at $0.16 (▼ -2.44%). Gold XAU/USD at $4,312.20 (▼ -1.11%). WTI Crude at $93.70 (▲ +3.40%). Bitcoin at $62,874 (▲ +2.28%).

Session Overview — Three-Way Stress Test

Monday's Asian session has opened under a three-way stress test of historic proportions: the worst Philadelphia Semiconductor Index collapse since March 2020, a yen in its third consecutive session grazing the BoJ's intervention danger zone at 160 per dollar, and stronger-than-expected Japanese GDP data that paradoxically makes Tokyo's equity market more — not less — vulnerable by raising the probability of a BoJ rate hike this month. The result is a Nikkei 225 down nearly 4%, Kioxia Holdings cratering 11%, and a cross-asset risk-off wave reverberating into AUD/JPY, the ASX 200, copper, and crypto simultaneously.

Japan's Q1 2026 GDP expanded at 0.5% quarter-on-quarter, beating the 0.3% consensus — and rising 1.8% year-on-year, surpassing the 1.3% forecast. Growth was driven by firming private consumption gaining 0.3% QoQ and robust external demand. In any other context, this would be unambiguously constructive for Japanese equities. In June 2026, however, it is being read as the final ingredient needed for the Bank of Japan to raise interest rates at its upcoming late-June meeting...

Continue reading...
0
0
NorthRay

Cryptocurrency: Why Everyone Is Talking About It and Whether I Should Get In (Spoiler: I’m Just Watching for Now)

Cryptocurrency: Why Everyone Is Talking About It and Whether I Should Get In (Spoiler: I’m Just Watching for Now)

Hi, this is NorthRay.🙌

While I’ve been learning Forex, indices, and gold trading, the entire internet has been shouting about Bitcoin.

— “Bitcoin hits a new all-time high!”
— “Crypto crashed — time to buy!”
— “A kid from Omsk bought Dogecoin and now drives a Lamborghini.”

I honestly tried to ignore it. But curiosity won.

So I decided to figure out what cryptocurrency actually is, how it works, what exchanges people trade it on, and whether it’s something a beginner trader like me should get involved with.

Spoiler: I still haven’t bought a single coin. But at least now I understand what everyone is talking about.

What Is Cryptocurrency? (A Simple Explanation)

Cryptocurrency is digital money. It has no physical form. No coins in your pocket, no banknotes in your wallet — just numbers on a screen.

The biggest difference between crypto and traditional money is that cryptocurrencies don’t have a central bank. No one can simply print more Bitcoin whenever they feel like it. No one can easily freeze your wallet. No single authority decides what a coin should be worth.

Here’s a simple way to think about it:

Imagine a notebook that is stored on millions of computers around the world at the same time. Every page in that notebook is a “block.” Whenever money is transferred, everyone can see the record. It can’t be erased, altered, or reversed.

That’s blockchain — the technology that powers cryptocurrency.🤔

The Main Features of Cryptocurrency

When I started learning about crypto, I identified five key differences from traditional money.

1. Decentralization

No bank or government controls cryptocurrency. It belongs to everyone and no one at the same time.

2. Limited Supply

There will never be more than 21 million Bitcoins. They can’t be “printed” like dollars or rubles. This helps...

Continue reading...
0
0

NFP Shock Crushes Gold & Equities, Bitcoin Hits 19-Month Low as Fed Rate Hike Fears Grip US Markets

NFP Shock Crushes Gold & Equities, Bitcoin Hits 19-Month Low as Fed Rate Hike Fears Grip US Markets

Week of 9–13 June 2026  ·  US Session  

★  US CPI Wednesday  ·  Fed Rate Hike Repricing  ·  Hormuz Watch  ·  Bitcoin 19-Month Low  ·  Visa Stablecoin Threat  ★

USD/CAD 1.3939  ·  USD/CHF 0.7960  ·  Gold $4,327.50  ·  WTI $91.77  ·  Dow 50,721.50  ·  Visa $323.57  ·  10Y 4.48%  ·  BTC $60,746  ·  LINK $7.36

Past Week in Review — 2–6 June 2026

The week of 2–6 June 2026 will be remembered as the week the US jobs market reset global rate expectations. Friday's NFP print of 172,000 — more than double the 85,000 consensus — triggered a violent repricing across every major asset class. Gold fell to its lowest since March 2026, the Dow dropped 1.35%, the Nasdaq shed nearly 4%, and the 10-year Treasury yield surged toward the 4.5% barrier that has historically acted as a stress threshold for equities. Bitcoin fell to a near 19-month low of $60,746 as the combination of risk-off selling, a stronger dollar, and renewed regulatory uncertainty around stablecoins created a multi-front bear environment. Chainlink, down 16.9% on the week to $7.36, reflected the broader altcoin de-rating underway.

For FX traders, USD/CAD navigated conflicting signals — a surging dollar from NFP-driven rate hike repricing versus a collapsing WTI crude price, down 2.69% on Friday on Iran ceasefire optimism. USD/CHF broke above 0.7870 on post-NFP dollar strength. Visa's stablecoin headline — confirming joint development of a platform with Stripe and Mastercard — introduced structural disruption risk to the payments incumbent's long-term revenue model. The US 10-year yield climbed 12 basis points on the week to 4.48%, approaching the critical 4.5% threshold that has historically triggered equity multiple compression, gold selloffs, and crypto de-risking. The week closes with every major US asset class positioned around a single fulcrum: Wednesday's US CPI for May.

Weekly...

Continue reading...
0
0

EUR/USD Surges to 1.1521, FTSE 100 Breaks 10,000 & Ethereum Consolidates Above $1,500

EUR/USD Surges to 1.1521, FTSE 100 Breaks 10,000 & Ethereum Consolidates Above $1,500

Week of 9–13 June 2026

★  US CPI Wednesday  ·  BoE Thursday  ·  USDA WASDE Wednesday  ·  LLOY Motor Finance  ·  ECB Rate Watch  ★

EUR/USD 1.1521  ·  GBP/USD 1.3337  ·  Silver $67.88  ·  Corn $417.96/bu  ·  FTSE 100 10,334.3  ·  LLOY 99.15p  ·  EU 10Y 2.84%  ·  ETH $1,544.43  ·  DOGE $0.0796

Past Week in Review — 2–6 June 2026

The European session week of 2–6 June 2026 was defined by a softening macro backdrop across the continent. EUR/USD's surge above 1.1500 — a level that had held for six consecutive weeks — was fuelled by broad USD weakness and market expectations of an ECB pivot. The Eurozone composite PMI fell to 49.6, its first contraction reading in five months, and two prominent ECB board members openly discussed cutting the deposit rate further in Q3, opening the path toward 1.1600 to 1.1650 as the next realistic near-term target.

GBP/USD closed at 1.3337, supported by the Bank of England's hold consensus and USD underperformance. EUR/GBP compressed to 0.8524 as the ECB's dovish drift diverged sharply from the BoE's services-CPI-constrained hawkishness. In equities, the FTSE 100's breakout above 10,000 to 10,334.3 was driven by broad commodity strength, recovering energy stocks, and diversified financials. Lloyds Banking Group surged 69.8% to 99.15p on relief that motor finance provision fears appear more contained than initially feared, approaching the psychologically significant 100p level for the first time in years.

In commodities, corn at $417.96/bu gained 5.80% on the week driven by the USDA's surprise 1.2 million acre reduction in its US corn acreage estimate — the largest single-month revision in four years — bringing the crop to its most bullish fundamental setup in six months. Silver surged 116% from prior year levels to $67.88/oz on broad USD weakness and safe-haven demand. The EU 10-year Bund...

Continue reading...
0
0

USD/JPY Breaches 160, NZD Under RBNZ Hawkish Watch & Global Risk-Off Grips Asia

USD/JPY Breaches 160, NZD Under RBNZ Hawkish Watch & Global Risk-Off Grips Asia

Week of 9–13 June 2026  ·  Asia-Pacific Session

★  EXTREME EVENT RISK WEEK  ·  BoJ Intervention Live  ·  US CPI Wednesday  ·  RBNZ June 15–16  ·  EIA Thursday  ★

USD/JPY 160.24  ·  NZD/USD 0.5796  ·  Copper $6.31/lb  ·  Nat Gas $3.22  ·  Hang Seng 24,680  ·  SOL $60.24  ·  LTC $42.56

Past Week in Review — 2–6 June 2026

The week of 2–6 June 2026 delivered a series of threshold events across every instrument in CSFX's Asia coverage. The dominant development was USD/JPY crossing 160.00 — the level the Bank of Japan has defended twice in the past 14 months — turning intervention from a tail risk into an active event probability. Goldman Sachs' full liquidation of Solana ETF exposure triggered a 5.75% single-week selloff in SOL, resetting institutional sentiment for the Solana ecosystem. On the commodity side, natural gas's 17.82% monthly surge — driven by Middle East LNG supply disruptions and above-average US temperatures — was only partially reversed by Friday's 3.21% pullback on reduced LNG export volumes. The Hang Seng's four-session losing streak, led by SMIC and Tencent declines, reflects the AI-sector correction on Wall Street feeding directly into Hong Kong's technology-heavy index. Copper declined 4.25% on the week, pulled lower by China demand uncertainty, though the structural electrification thesis remains intact and the dip has brought the price to CSFX's target entry zone. Litecoin was the hardest hit, falling 11.94% through the prior $47 support band and into the $40–$44 demand zone where the 2027 pre-halving accumulation thesis now activates.

Weekly closes: USD/JPY at 160.24, breaching the 160.00 BoJ intervention threshold. NZD/USD down 1.93% on the week to 0.5796, pulling back sharply from its 5-week high. Copper down 4.25% to $6.31/lb on softer China industrial data, now 6% below the $6.716 all-time high. Natural gas down 3.21%...

Continue reading...
0
0

NFP Beats Hard, S&P Lifts as Dollar Firms & Bitcoin Slides Below $61K

NFP Beats Hard, S&P Lifts as Dollar Firms & Bitcoin Slides Below $61K

Friday, 5 June 2026  ·  New York Open  ·  Capital Street FX Research Desk

NFP +172K May  ·  Unemployment 4.3%  ·  US 10Y 4.52%  ·  Fed Hike Probability 85%

Fed Funds 5.25%  ·  CPI Apr 3.4%  ·  Next FOMC Jun 17–18  

Session Prices — New York Session, 5 June 2026

S&P 500 at 7,550.5 (+0.59%). Nasdaq Composite at 39,432 (+0.61%). Dow Jones at 51,448 (+0.99%). USD/CAD at 1.3913 (+0.27%). USD/CHF at 0.7945 (+0.66%). US 10-year Treasury yield at 4.52% (+0.04%). WTI Crude at $91.47 (-3.32%). Gold XAU/USD at $4,348.10 (-2.58%). Wheat CBOT July at 608.75¢/bu (-0.29%). Bitcoin at $60,912.5 (-1.83%). Cardano ADA at $0.1604 (-2.10%). Intel at $107.31 (-4.20%). VIX at 16.52.

The NFP Story — Three Crossfires at Once

Friday's New York session opened into a market already shaken by three simultaneous stress tests: a stronger-than-expected NFP print, a sector-crushing selloff in semiconductor stocks triggered by Broadcom's AI chip outlook, and a crypto market that has shed more than 14% across seven consecutive sessions. The Federal Reserve's rate path is the thread binding them all — and today's jobs data just made the June 17-18 FOMC meeting materially more hawkish in character.

May's non-farm payroll report delivered 172,000 new jobs, firmly beating the consensus estimate of 130,000 and following an upward revision of April to 214,000. The unemployment rate held at 4.3%. Gains were led by leisure and hospitality, local government, and healthcare. Markets now price an 85% probability of at least one 25 basis-point rate hike before year-end, up from 60% a week ago. The 10-year Treasury yield climbed to 4.52% immediately post-release. The NFP result effectively forecloses any near-term Fed cut — the first rate reduction is now pushed to early 2027 in the base case.

The technology sector is experiencing its most severe single-session decline...

Continue reading...
0
0

ECB Eve Jitters, Euro Firms on Inflation Data & CAC 40 Steadies Friday, 5 June 2026 | European Session — London Open | Capital Street FX Research Desk

ECB Eve Jitters, Euro Firms on Inflation Data & CAC 40 Steadies Friday, 5 June 2026 | European Session — London Open | Capital Street FX Research Desk

KEY EVENT: ECB Rate Decision — June 11  |  25bp Hike 90% Priced  |  ECB Deposit Rate 2.00%  |  Euro CPI 3.2% (May, highest since late 2023)

EUR/USD 1.1638  ·  EUR/GBP 0.8644  ·  Lead $2,014.51/T  ·  Corn 420.56¢/bu  ·  CAC 40 8,278.1  ·  AstraZeneca £13,150  ·  EU 20Y 3.48%  ·  USDT $1.0001  ·  BNB/USD $594.5


Session Overview — European Markets

Friday's European session opens with an unusual and defining tension: the euro is firming ahead of a rate hike that is already almost fully priced — a reminder that in modern markets, anticipation can both deliver and disappoint. With the European Central Bank's June 11 decision six days away and May eurozone inflation confirmed at 3.2%, the question is no longer whether the ECB will hike, but how hawkish the guidance will be and what comes next.

The macro backdrop is dense. Eurozone inflation rose to 3.2% in May — its highest reading since late 2023, with core at 2.5% and services inflation surging to 3.5%. These data points have pushed money markets to price a near-certain 25 basis-point hike at the June 11 meeting, lifting the ECB deposit rate from 2.00% to 2.25%, with a second hike priced for September and a third increasingly likely before year-end. ECB Governing Council member Isabel Schnabel on Monday added a hawkish note: it is too early to determine the exact number of rate hikes — a deliberate signal that the ECB is not inclined to front-run market guidance. Bank of Italy Governor Fabio Panetta was equally pointed: the forward-looking picture calls for a recalibration to counter the risk of persistent inflationary tensions.

Beneath the ECB narrative, the geopolitical picture remains the dominant risk overlay. Iran hostilities continue to disrupt oil supply chains and push energy-driven inflation across Europe. A conditional Lebanon...

Continue reading...
0
0

Bitcoin: What the Capitulation of the Coin’s Top Holders Is Telling Us

Bitcoin: What the Capitulation of the Coin’s Top Holders Is Telling Us
The Strongest Hands Have Finally Given Up

The world of Bitcoin has its own hierarchy of resilience. Newcomers buy at the top and sell at the bottom. Experienced traders try to time the market but often get it wrong. And then there is a special class of investors: long-term holders. These are the people who buy coins and leave them untouched in their wallets for months or years. They do not react to the news. They do not stare at charts every hour. They simply believe.

They believe that Bitcoin is the future of money, that the current price is irrelevant, and that sooner or later everything will pay off.

These people form the backbone of the Bitcoin community. They are often called “diamond hands.” As long as they hold, the market has a floor. As long as they are not selling, a decline does not turn into a collapse.

But in recent weeks, something has broken. Long-term holders—those who have held their coins for at least 155 days—have become sellers. And they are selling a lot. A very large amount.

According to analysts at Compass Point, they sold roughly $2.4 billion worth of Bitcoin over the past two days. Two and a half billion dollars in just 48 hours. This is not profit-taking. This is an exodus. This is capitulation.

Ed Engel, a Compass Point analyst who tracks long-term holder behavior, notes that these investors were largely inactive from February through April. They sat on their coins, watched Bitcoin fall from its October highs above $126,000, and did not budge. They endured. They hoped for a reversal.

But hope has faded. The price has fallen below $64,000. The conflict in the Middle East is not ending—it is escalating. Institutional investors have withdrawn money from Bitcoin ETFs for twelve consecutive...

Continue reading...
0
0

Cardano Cryptocurrency Plunges 10% in a Bearish Market Pullback

Cardano Cryptocurrency Plunges 10% in a Bearish Market Pullback
Friday the 13th for ADA Holders

Friday turned into a bloodbath for Cardano supporters. Cardano, once among the world's top three cryptocurrencies and a contender for the throne, fell 10.17% in a single day. The price dropped to $0.1728, marking its sharpest decline since June 4 and coming at a time when the broader market was already on edge.

The numbers confronting ADA holders are enough to break the heart of even the most resilient crypto enthusiast. Cardano’s market capitalization shrank to $6.28 billion. That sounds enormous until you remember that at its peak in 2021, Cardano was worth nearly $95 billion. Since then, its value has evaporated like morning mist. The token has lost 94% of its value from its all-time high of $3.10 reached on September 2, 2021.

Over the past week, Cardano has fallen 26%. Twenty-six percent in seven days is not a correction—it is a collapse. Trading volume over the last 24 hours reached nearly $937 million, accounting for 0.69% of the entire cryptocurrency market's turnover. People are selling in panic. Some are cutting their losses; others are simply leaving and may never return to the asset.

At the time of writing, Cardano ranks 15th among all cryptocurrencies by market capitalization. It was once third. That decline in ranking is perhaps the clearest indication of how much has gone wrong.

But the most frightening aspect for holders is not the numbers themselves. It is the news accompanying them. Project founder and spiritual leader Charles Hoskinson announced that he is taking a “creative break.” Just four words posted on X: “I'm taking a break. TTYL.” The market heard those words—and collapsed.

Four Words That Wiped Out Billions

It is difficult to overstate Hoskinson’s influence on Cardano. He is not merely the founder; he is the face, voice,...

Continue reading...
0
0

Strategy Shares Fall After First Bitcoin Sale Since 2022

Strategy Shares Fall After First Bitcoin Sale Since 2022
From an ironclad “never” to the first step back

The cryptocurrency market is used to surprises, but the news that emerged this past Monday caught even the most seasoned Bitcoin enthusiasts off guard. Strategy Inc. — a company that for years has served as a living symbol of unwavering faith in Bitcoin — has sold part of its Bitcoin holdings. For the first time since 2022. The amount was modest, around $2.5 million. Yet the mere fact of the sale sent the company’s stock down nearly 5% in premarket trading.

For those who have followed the story of Strategy (formerly known as MicroStrategy), this move looks like a crack in the foundation. Michael Saylor, the company’s co-founder and chief evangelist, spent years repeating the same mantra: “We do not sell Bitcoin. Ever.” His strategy was brilliantly simple — borrow money, issue bonds, raise capital by any available means, and convert it into Bitcoin. Accumulate at all costs. Hold indefinitely. And now, that narrative has begun to soften.

What Happened

Investors and analysts immediately turned to the regulatory filings submitted after the transaction. What they found was intriguing: the sale was not a panic move or a forced liquidation during a market downturn. Strategy remains the world’s largest corporate holder of Bitcoin, with approximately $61 billion worth of the cryptocurrency still on its balance sheet. The sale was largely symbolic and does not alter the broader picture.

But this is not really about the money. It is about the signal.

When someone who has spent years pledging eternal commitment suddenly takes a step back, the market starts asking questions. The stock did not fall because the company lost $2.5 million. It fell because traders realized that the principle of “buy only, never sell” is no longer absolute.

Saylor himself hinted at...

Continue reading...
0
0
Navigation menu
instaforex banner