Financial Market Foundations: Understanding Asset Classes and Tickers
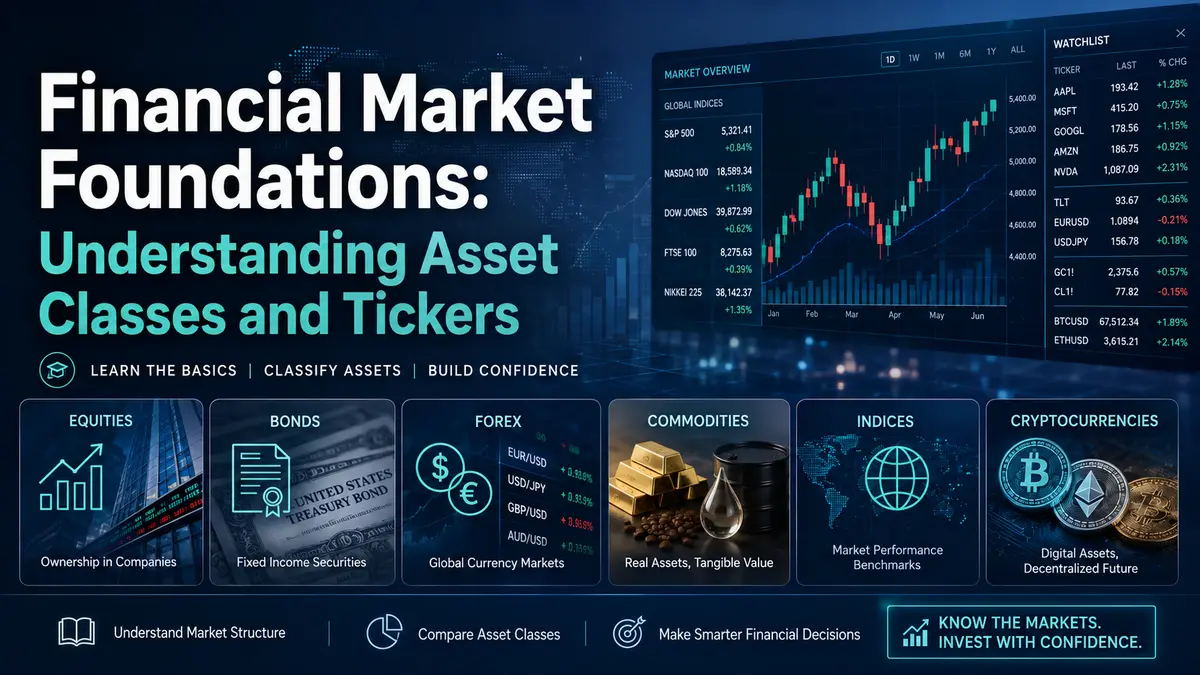
In modern financial ecosystems, trading is no longer confined to physical floors or narrow asset classes. Today’s digital infrastructure grants market participants immediate access to a massive variety of global instruments. To trade effectively, you must understand exactly what you are buying or selling, how these assets are categorized, and how the global pricing mechanisms identify them.
Every asset class carries its own specific risk profile, liquidity metrics, and structural behavior. Navigating this vast landscape requires mastering the language of the exchange, starting with how securities are labeled.
Decoding the Market: What is a Ticker?
When you look at a modern trading terminal, you rarely see full corporate names like “Apple Inc.” or “Microsoft Corporation.” Instead, you see short alphanumeric codes.
The unique identifier assigned to an asset on an exchange or within an information system is called a ticker (often represented with a # symbol in trading software).
The Role of Unique Identifiers
Tickers emerged out of sheer operational necessity during the era of the telegraph and mechanical ticker tape machines. Printing full company names across thousands of transactions created immense delays. By reducing a company’s identity to a handful of letters, exchanges drastically optimized data transmission speeds.
In today’s algorithmic environment, tickers remain the universal shorthand for data feeds, chart systems, and electronic order books. They prevent administrative confusion, ensuring that capital is directed to the exact security intended, independent of language barriers or local corporate naming shifts.
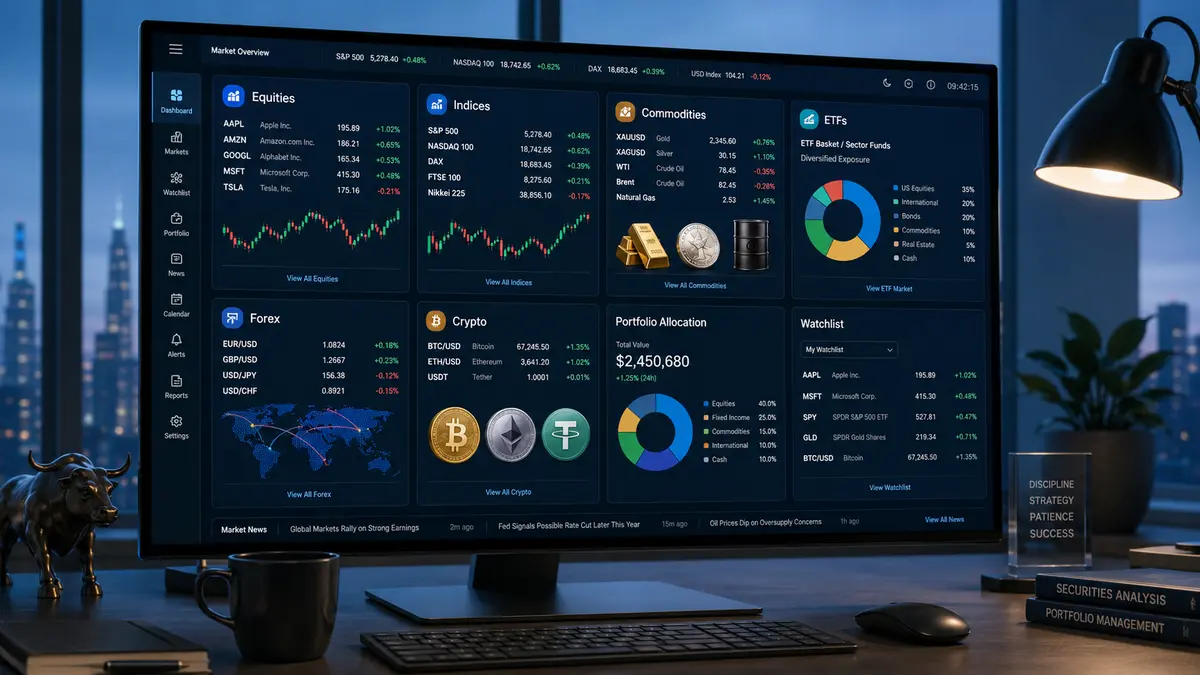
Navigating the Major Asset Classes
Modern multi-asset trading applications typically classify financial instruments into several distinct macro categories. Properly allocating your capital across these divisions is the foundation of institutional portfolio management.
1. The Equities Market (Stocks)
A stock represents a fractional share of ownership in a corporation. When you purchase a stock, you are effectively buying a claim on a portion of that company’s assets and future earnings. In the global equity arena, the world’s largest tech, consumer, and automotive companies command the highest trading volumes.
-
# AAPL (Apple Inc.): A global consumer electronics powerhouse. Beyond its heritage in personal computers and smartphones, its modern valuation is driven by services infrastructure, ecosystem lock-in, and major expansions into spatial computing and consumer-facing artificial intelligence.
-
# AMZN (Amazon.com Inc.): The absolute titan of e-commerce and a global pioneer in public cloud infrastructure via its Amazon Web Services (AWS) division. It serves as a core backbone for modern internet infrastructure and enterprise machine learning deployment.
-
# GOOGL (Alphabet Inc.): The global gateway to information. Reorganized under the Alphabet holding umbrella, its core revenue engine remains digital advertising and search dominance, paired with massive investments in deep learning networks, autonomous systems, and cloud architectures.
-
# MSFT (Microsoft Corporation): One of the largest software and cloud enterprises globally. It develops proprietary operating systems, business productivity software, and global infrastructure solutions via Azure, anchoring enterprise computing around the world.
-
# MCD (McDonald’s Corporation): A global fast-food giant operating a highly lucrative franchising system. In financial circles, it is valued as much for its immense underlying real estate portfolio as it is for its defensive consumer staple footprint.
-
# NKE (Nike, Inc.): An international powerhouse in athletic footwear, apparel, and equipment. It serves as a key barometer for global consumer discretionary spending and direct-to-consumer digital retail trends.
-
# TSLA (Tesla Inc.): A clean energy disruptor that transformed the automotive space. It focuses heavily on electric vehicle manufacturing, commercial battery storage tech, automated driving networks, and advanced robotics.
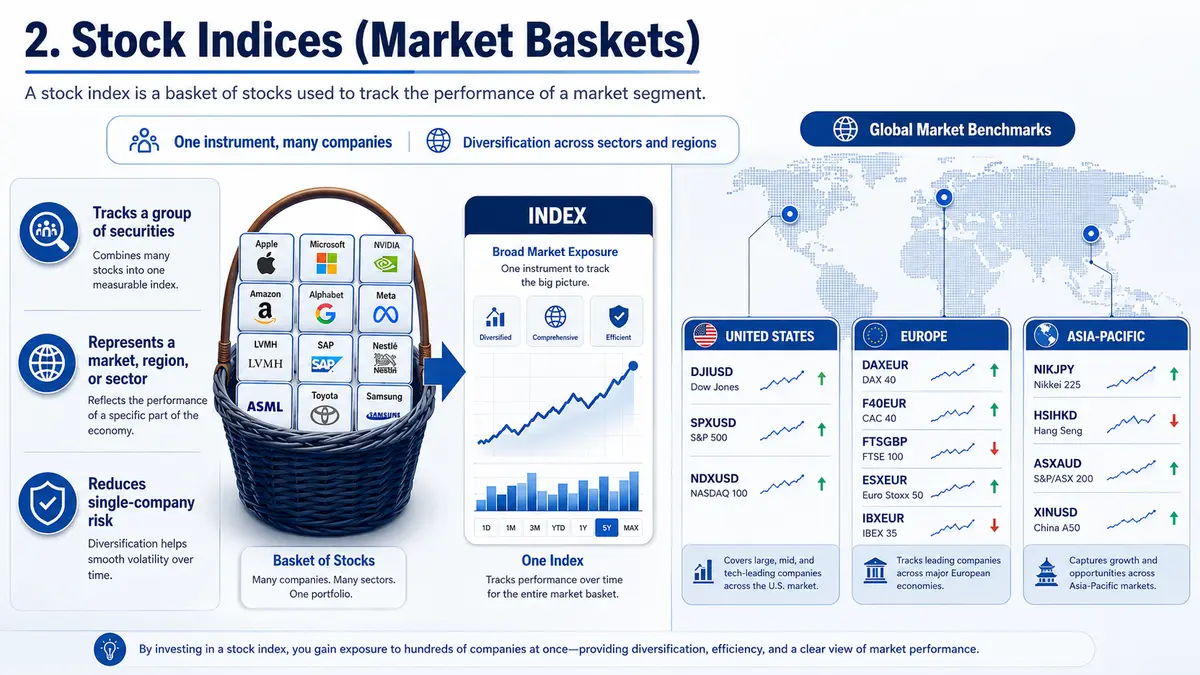
2. Stock Indices (Market Baskets)
A stock index is a mathematical metric that tracks the performance of a specific group of securities. Think of an index as a pre-packaged “basket” of stocks gathered into a single instrument based on a unifying characteristic, such as market size, geographic location, or industry sector.
The Mechanics of Index Investing
When you trade or buy an index derivative, you aren’t picking an individual winning stock. Instead, you are taking a broader position on the health of an entire industry, a national economy, or a specific corporate tier. This offers instant diversification because market shocks affecting a single company are naturally smoothed out by the other components within the basket.
Global Benchmark Profiles
-
DAXEUR (DAX 30 / 40): The benchmark index tracking the largest, most liquid blue-chip companies trading on the Frankfurt Stock Exchange, reflecting the core industrial strength of Germany.
-
F40EUR (CAC 40): The primary index for the French equities market, heavily influenced by global luxury brands, energy conglomerates, and industrial giants.
-
FTSGBP (FTSE 100): The top index of the London Stock Exchange, dominated by multinational commodities firms, financial institutions, and consumer defensive staples.
-
ESXEUR (Euro Stoxx 50): A blue-chip index representing the eurozone’s absolute leading corporations across various sectors, providing a macro view of the European economy.
-
IBXEUR (IBEX 35): The official index tracking Spain’s domestic market liquidity, heavily weighted toward financial institutions and utility providers.
-
DJIUSD (Dow Jones Industrial Average): A price-weighted measurement tracking 30 massive, historic US blue-chip companies across core industrial sectors.
-
SPXUSD (S&P 500): Widely regarded as the ultimate gauge of the US equity market, tracking the 500 largest market-cap corporations across all economic sectors.
-
NDXUSD (NASDAQ 100): A modified market-cap index consisting of the 100 largest non-financial companies on the Nasdaq, heavily weighted toward high technology, biotechnology, and growth software.
-
NIKJPY (Nikkei 225): The premier price-weighted index for the Tokyo Stock Exchange, functioning as the primary indicator for the Japanese economy.
-
HSIHKD (Hang Seng Index): The core market-cap weighted index tracking the largest companies on the Hong Kong Stock Exchange, serving as a primary link to East Asian capital flows.
-
ASXAUD (S&P/ASX 200): The benchmark index for Australia, heavily exposed to the global mining, metals, and banking industries.
-
XINUSD (China A50): An index tracking the top 50 mega-cap companies listed on mainland Chinese exchanges (Shanghai and Shenzhen), heavily utilized by macro fund managers.
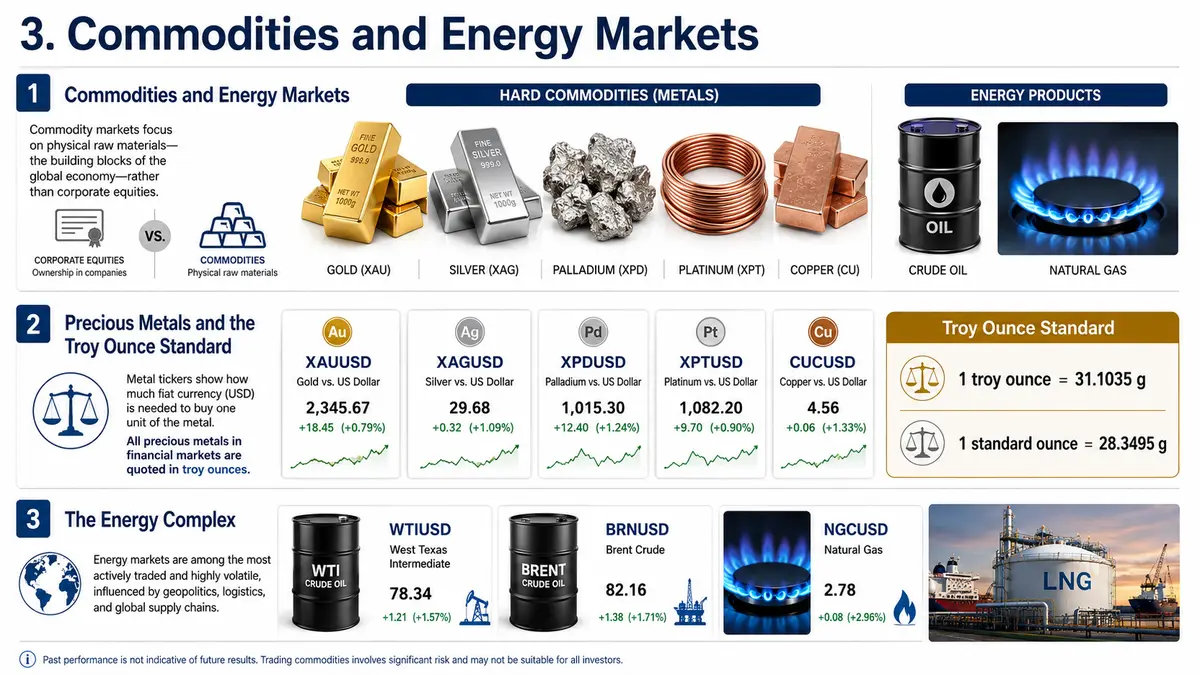
3. Commodities and Energy Markets
The commodity market deals with physical raw materials rather than corporate equities. This market is divided into hard commodities (metals and energies) and soft commodities (agricultural goods).
Precious Metals and the Troy Ounce Standard
Precious metals are historically anchored as inflation hedges and essential industrial raw materials. In modern electronic trading, they are identified by standardized symbols:
-
XAUUSD: Gold vs. US Dollar
-
XAGUSD: Silver vs. US Dollar
-
XPDUSD: Palladium vs. US Dollar
-
XPTUSD: Platinum vs. US Dollar
-
CUCUSD: Copper vs. US Dollar
The structural format of a metal ticker tells you exactly how much fiat currency is required to purchase one unit of the underlying metal.
Important Technical Correction: This part trips up many new traders—precious metals in global financial markets are not measured in standard grocery ounces (avoirdupois ounces, which equal 28.3495 grams). Instead, institutional markets strictly trade in troy ounces. One troy ounce is exactly 31.1035 grams. Miscalculating this weight discrepancy can lead to severe mathematical errors when evaluating contract physical delivery metrics or margin exposures.
The Energy Complex
Energy trading is highly volatile, driven directly by geopolitical friction, global logistics infrastructure, and shifting supply chains:
-
WTIUSD (West Texas Intermediate): A light, sweet crude oil grade extracted primarily from US fields, serving as the benchmark for the Western hemisphere.
-
BRNUSD (Brent Crude): A key global pricing benchmark sourced from North Sea oil fields, dictating pricing for a vast majority of seaborne oil shipments internationally.
-
NGCUSD (Natural Gas): A highly seasonal, volatile commodity tied to heating infrastructure, industrial power production, and global liquefied natural gas (LNG) export dynamics.
4. ETFs and Regional Fund Structures
An ETF (Exchange-Traded Fund) is an investment fund that tracks an underlying index, commodity, or basket of assets, but trades directly on public stock exchanges just like standard corporate shares. ETFs allow retail and institutional investors to target niche themes (like cybersecurity, green energy, or lithium mining) without purchasing dozens of separate corporate instruments.
In various localized markets, you will find domestic equivalents.
For example, a BPIF (Exchange-Traded Mutual Fund) serves as a regional structural analog to international ETFs within specific local jurisdictions, allowing domestic capital pools to access diversified asset indexes while remaining under local regulatory frameworks.
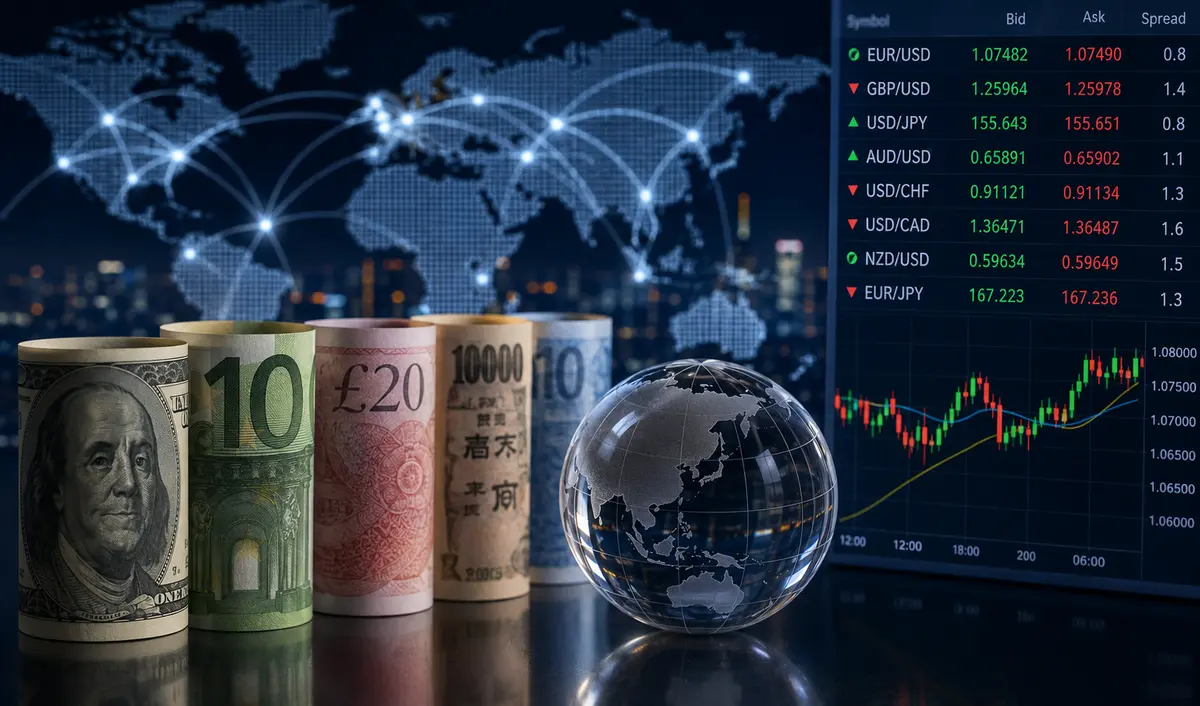
5. The Foreign Exchange (Forex) Market
The foreign exchange market is the largest, most liquid financial venue on Earth, handling trillions of dollars in daily turnover. Unlike centralized stock markets, Forex operates as an over-the-counter decentralized network where global central banks, commercial institutions, and retail traders swap currencies.
Understanding Asset Liquidity
The primary defining feature of the currency market is its immense liquidity.
Liquidity refers to the ease and speed with which an asset can be converted into cash without triggering a significant change in its market price.
-
High Liquidity: Assets can be sold instantly with minimal transaction costs (spreads) due to a massive, constant pool of buyers and sellers.
-
Low Liquidity: Assets take substantial time to sell, and forcing an immediate transaction requires accepting a severe discount on the price.
Currencies of dominant economic nations are highly liquid, meaning transactions clear in milliseconds with virtually zero friction.
ISO 4217 Standardization
To maintain global order, currencies are assigned universal three-letter abbreviations mandated by the International Organization for Standardization (ISO 4217):
-
USD: United States Dollar ($)
-
EUR: Eurozone Euro (€)
-
GBP: Great Britain Pound Sterling (£)
-
JPY: Japanese Yen (¥)
-
CHF: Swiss Franc (Fr)
-
AUD: Australian Dollar (A$)
-
CAD: Canadian Dollar (C$)
-
NZD: New Zealand Dollar (NZ$)
-
CNH: Chinese Yuan Offshore (¥)
-
SEK: Swedish Krona (kr)
-
NOK: Norwegian Krone (kr)
-
DKK: Danish Krone (kr)
-
SGD: Singapore Dollar (S$)
-
HKD: Hong Kong Dollar (HK$)
-
ZAR: South African Rand (R)
-
MXN: Mexican Peso (MX$)
-
PLN: Polish Zloty (zł)
-
TRY: Turkish Lira (₺)
-
HUF: Hungarian Forint (Ft)
-
CZK: Czech Koruna (Kč)
-
ILS: Israeli New Shekel (₪)
-
THB: Thai Baht (฿)
Anatomy of a Currency Pair
Currencies are never traded in isolation; they are priced relative to one another.
This relationship forms a currency pair structure:
Base Currency / Quote Currency = Exchange Rate
The first currency is the Base Currency, representing exactly 1 unit. The second currency is the Quote Currency, showing how much of that currency is needed to buy 1 single unit of the base currency.
For example, if you see EUR/USD = 1.0748, it means exactly 1 Euro is worth 1.0748 US Dollars.
Forex contracts are rigidly standardized into two major structural expressions relative to the global reserve currency:
-
Direct Quotes: This expression displays the exact amount of US Dollars contained within a single unit of a foreign currency. Examples include EUR/USD or GBP/USD.
-
Indirect (Reverse) Quotes: This format demonstrates the exact amount of foreign national currency required to purchase one single US Dollar. Examples include USD/JPY, USD/CAD, or USD/CHF.
Pairs containing the US Dollar on either side are classified as the Majors, capturing the absolute highest concentration of global liquidity.
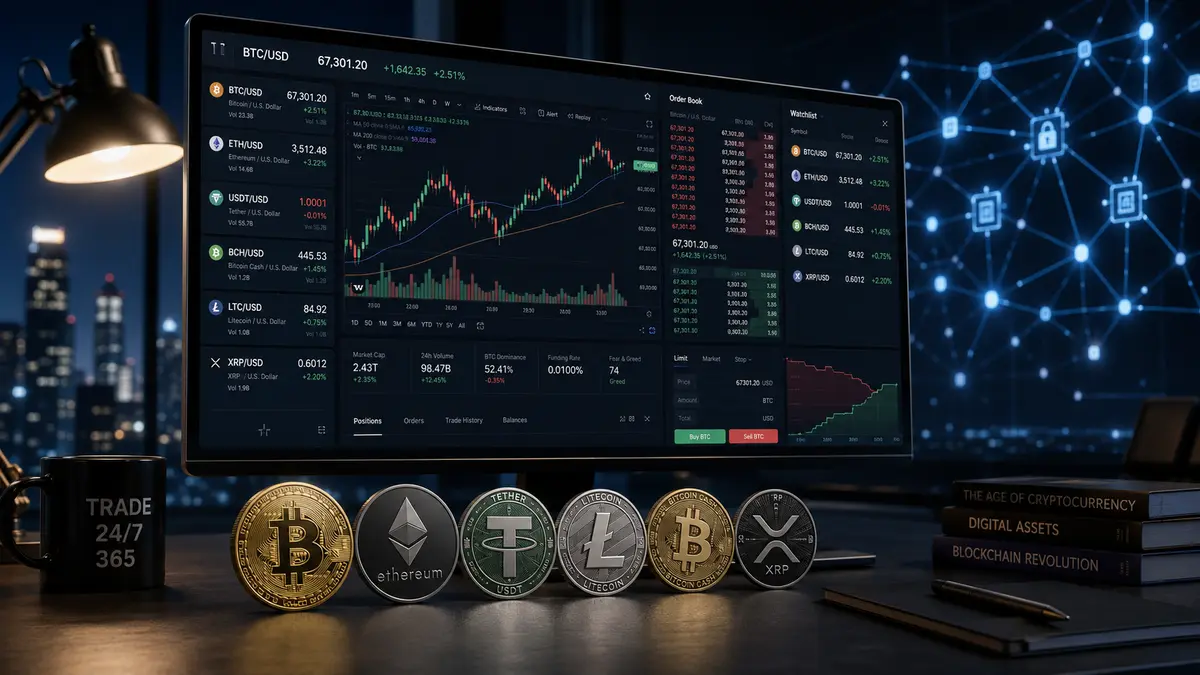
6. The Digital Frontier: Cryptocurrencies
The cryptocurrency landscape has evolved from an experimental cryptographic concept into a massive digital asset class. Operating on decentralized blockchain networks, these instruments feature continuous 24/7/365 availability completely independent of traditional market operating hours.
In software interfaces, crypto assets follow standard shorthand codes similar to traditional fiat pairs:
-
BTC: Bitcoin (The primary decentralized digital store of value)
-
ETH: Ethereum (The foundational smart-contract platform)
-
USDT: Tether (A fiat-pegged stablecoin used to preserve dollar liquidity)
-
BCH: Bitcoin Cash
-
LTC: Litecoin
-
XRP: Ripple
Driven by decentralized launchpads, layered scaling networks, and institutional spot ETFs, online tracking platforms like CoinMarketCap now catalog millions of distinct digital tokens. While a vast majority of these tokens possess minimal liquidity, the major blue-chip crypto pairs (such as BTC/USD or ETH/USD) regularly process massive institutional volume alongside standard fiat currencies.
7. Sophisticated Derivatives: Non-Deliverable Forwards (NDFs)
For advanced market participants operating across global borders, managing currency risk in emerging markets requires specialized tools. A Non-Deliverable Forward (NDF) is a cash-settled, short-term forward contract on a foreign currency pair where the underlying currency faces strict capital controls or limited liquidity.
Because the restricted local currency cannot be easily transferred or exchanged internationally, the contract does not require physical delivery of the underlying asset. Instead, the two counter-parties calculate the difference between the pre-agreed forward exchange rate and the spot rate at contract maturity.
The net profit or loss is then settled entirely in a freely convertible reserve currency — most commonly the US Dollar. This provides multinational enterprises and institutional hedge funds a highly efficient venue to hedge local currency exposures without running into regulatory or structural roadblocks.

Comments
No comments yet. Be the first to share your thoughts!
Authentication Required
You must be logged in to post a comment.