

Here I hold you by your hands and and explain support and resistance like a baby.
Dont know how to identify your support and resistance? Then read this article,it is packed with everything u need.
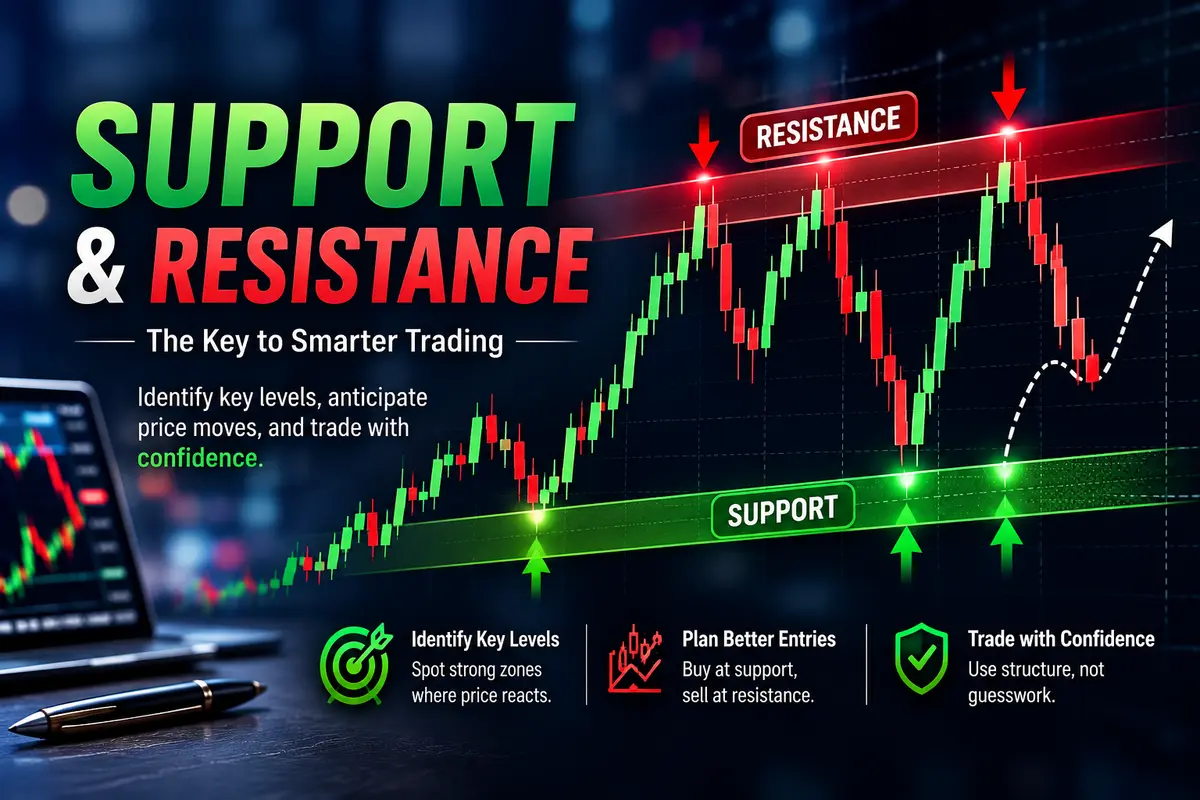
If u go to any broker, open an account then start watching the market,thats the candstick,the trend line,it keeps moving up and down, high high ,low low ,reverse and up down,but u will always see that at the down part of the chart, and upper side, There is always a place the candstick use to stop,thats the place traders identify as support,when many buyers have step in ,as resistance when sellers have step in.
Support is a price level where a falling market tends to slow down or stop because buyers begin to enter the market. As demand increases, selling pressure starts to fade, making it difficult for the price to continue moving lower. Resistance works in the opposite way. It is an area where an upward-moving market struggles to continue because sellers become more active, increasing supply and slowing the rally.
These levels are not magic lines that always hold. Instead, they represent zones where many traders expect the market to react. That expectation often influences buying and selling decisions, making support and resistance important tools in technical analysis.
One reason these levels matter is market psychology. Imagine a currency pair drops to a price where buyers previously entered in large numbers. Many traders remember that level and expect the same thing to happen again. Some place buy orders there, while others close their short positions to secure profits. As buying activity increases, the market may bounce.
The same idea applies to resistance. If a price has struggled to move above a certain level before, traders may expect history to repeat itself. Some begin selling near that area, while others take profits on existing long positions. The increased selling pressure...
