

Here I hold you by your hands and and explain support and resistance like a baby.
Dont know how to identify your support and resistance? Then read this article,it is packed with everything u need.
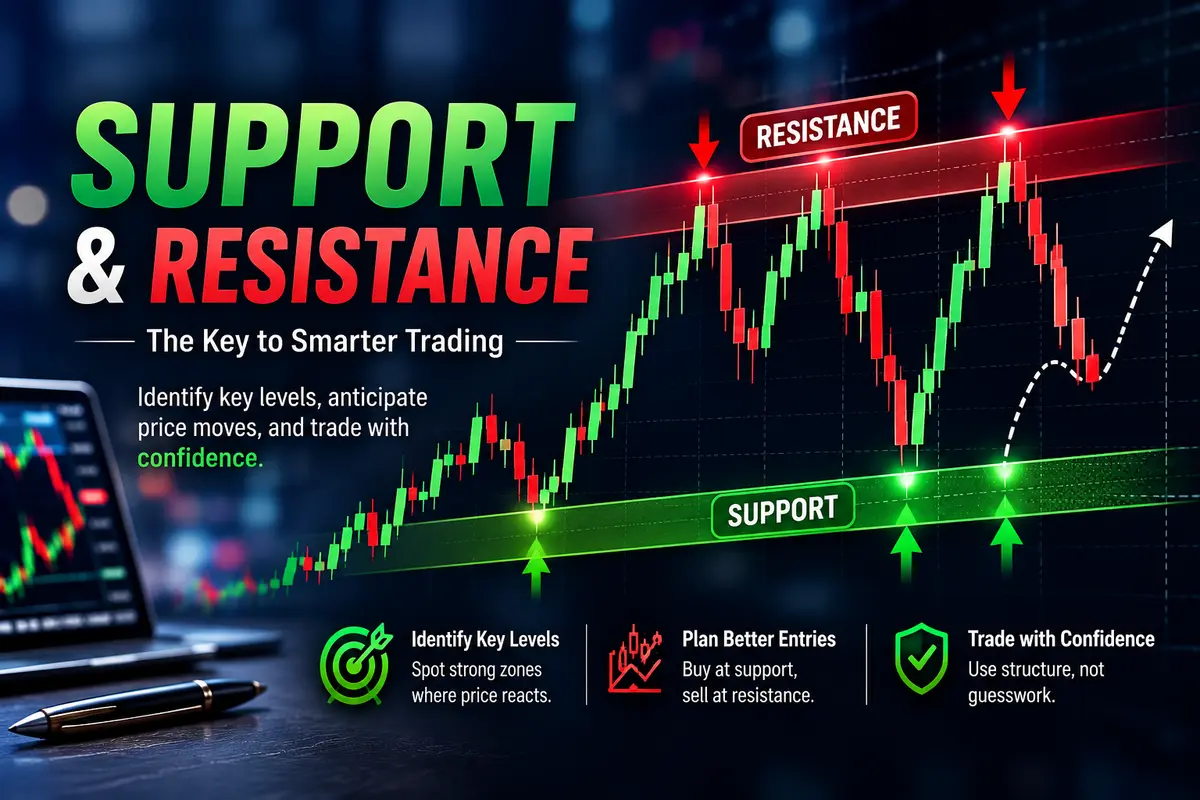
If u go to any broker, open an account then start watching the market,thats the candstick,the trend line,it keeps moving up and down, high high ,low low ,reverse and up down,but u will always see that at the down part of the chart, and upper side, There is always a place the candstick use to stop,thats the place traders identify as support,when many buyers have step in ,as resistance when sellers have step in.
Support is a price level where a falling market tends to slow down or stop because buyers begin to enter the market. As demand increases, selling pressure starts to fade, making it difficult for the price to continue moving lower. Resistance works in the opposite way. It is an area where an upward-moving market struggles to continue because sellers become more active, increasing supply and slowing the rally.
These levels are not magic lines that always hold. Instead, they represent zones where many traders expect the market to react. That expectation often influences buying and selling decisions, making support and resistance important tools in technical analysis.
One reason these levels matter is market psychology. Imagine a currency pair drops to a price where buyers previously entered in large numbers. Many traders remember that level and expect the same thing to happen again. Some place buy orders there, while others close their short positions to secure profits. As buying activity increases, the market may bounce.
The same idea applies to resistance. If a price has struggled to move above a certain level before, traders may expect history to repeat itself. Some begin selling near that area, while others take profits on existing long positions. The increased selling pressure can cause the market to pause or reverse.
Finding support and resistance does not require complicated indicators. A simple price chart is often enough. Look for areas where the market has changed direction several times. The more often a level has been tested, the more attention traders usually give it. However, remember that these are zones rather than exact prices. The market may move slightly above or below them before changing direction.
Trendlines are another useful way to identify support and resistance. In an uptrend, a rising trendline can act as support as long as buyers remain in control. In a downtrend, a falling trendline may serve as resistance by limiting upward price movements. Combining horizontal levels with trendlines can provide a clearer view of market structure.
Moving averages can also work as dynamic support and resistance. Many traders pay close attention to the 50-period and 200-period moving averages. During strong trends, prices often react around these averages before continuing in the direction of the trend. While they should not be used alone, they can confirm what the price chart is already showing.
Support and resistance become even more valuable when combined with candlestick patterns. For example, a bullish engulfing candle forming near a strong support level may suggest buyers are taking control. Likewise, a bearish engulfing candle near resistance could indicate that sellers are stepping back into the market. Waiting for confirmation instead of entering immediately can improve the quality of trading decisions.
Breakouts are another important concept. Sometimes the market gathers enough momentum to move beyond a support or resistance level. When resistance is broken, it often becomes new support. Likewise, once support is broken, it may turn into resistance. This change in market behavior is known as a role reversal and is closely watched by experienced traders.
False breakouts can happen as well. The price may briefly move beyond a level, attract traders into the market, and then quickly reverse. This is why many traders wait for a candle to close above or below the level before making a decision. Patience can reduce the chances of entering on a false signal.
Risk management can never be over talked about, always set your account to stop loss,if the market turns against your predictions and analysis.
And if paraventure lost happens after all ur efforts,just know it is part of the journey,but remember when u go to the market and they are fighting u need to run not only leave early
New traders often make the mistake of drawing too many lines on their charts. This creates confusion and makes decision-making harder. Focus on the most obvious levels where price has reacted several times. Clean charts are usually easier to read and often lead to better trading decisions.
Support and resistance are not designed to predict the future with certainty. Instead, they help traders identify areas where price is more likely to react. When combined with trend analysis, candlestick patterns, volume, and proper risk management, these levels become powerful tools for understanding market behavior.
Overall, learning to identify your support and resistance levels will help u save your money, because support and resistance are one of the 2 things u should consider before entering or opening a trade.
It will help u stay disciplined, knowing that if u rush without studying ur chart, u will lose ur money, so always study ur chart through candle stick and trends so to identify ur support and resistance levels, in order to know when to buy or sell, when to enter and when to exit.

Comments
No comments yet. Be the first to share your thoughts!
Authentication Required
You must be logged in to post a comment.