Bar Pipa
We pay for a post of 10$

Forex

joy

USD/CLP – The Copper Proxy, Pension Flows, and BCCh Boundary Management
USD/CLP – The Copper Proxy, Pension Flows, and BCCh Boundary Management

If you want a pure, unadulterated macro play on global heavy industry and Chinese factory demand, look no further than the Chilean Peso.

Where other Latin American pairs like the Mexican Peso or Brazilian Real get pulled around by high carry yields or agricultural trade cycles, USD/CLP trades almost like a inverse derivative of physical copper futures. Chile produces roughly a quarter of the world’s mined copper, making the Peso the ultimate benchmark for global manufacturing health and raw material supply chains.

The Industrial Engine: Copper and the Chinese Transmission

The mechanics behind USD/CLP start at the mine site and end in Shanghai.

Because copper sales account for the lion's share of Chile’s total export revenues, fluctuations in the metal directly alter the volume of Dollars entering the country:

  • The Inflow Rally: When global industrial output expands or China rolls out major infrastructure stimulus, copper prices surge. Chilean mining conglomerates see revenues jump and sell US Dollars on local spot desks to meet domestic taxes, wages, and operational costs. That commercial conversion pressure drives USDCLP ... lower.

  • The Growth Drag: When global manufacturing contracts or China’s real estate sector stumbles, copper prices slide. Exporter Dollar supplies dry up immediately, leaving domestic import demand unhedged and pushing USD/CLP into fast upward rallies.

Traders often keep a chart of COMEX or LME Copper futures ($HG) overlayed against USD/CLP. On most days, a sharp break in copper leads spot FX price action by minutes, providing an early signal for momentum traders.

The Local Heavyweight: Pension Fund Rebalancing (AFPs)

Beyond raw commodities, the biggest domestic player on the USD/CLP order book isn't the government—it's Chile's network of private pension funds, known locally as AFPs (Administradoras de Fondos de Pensiones).

These funds manage well over $150 billion in assets, holding a huge chunk of those portfolios...
Continue reading...
0
0
joy

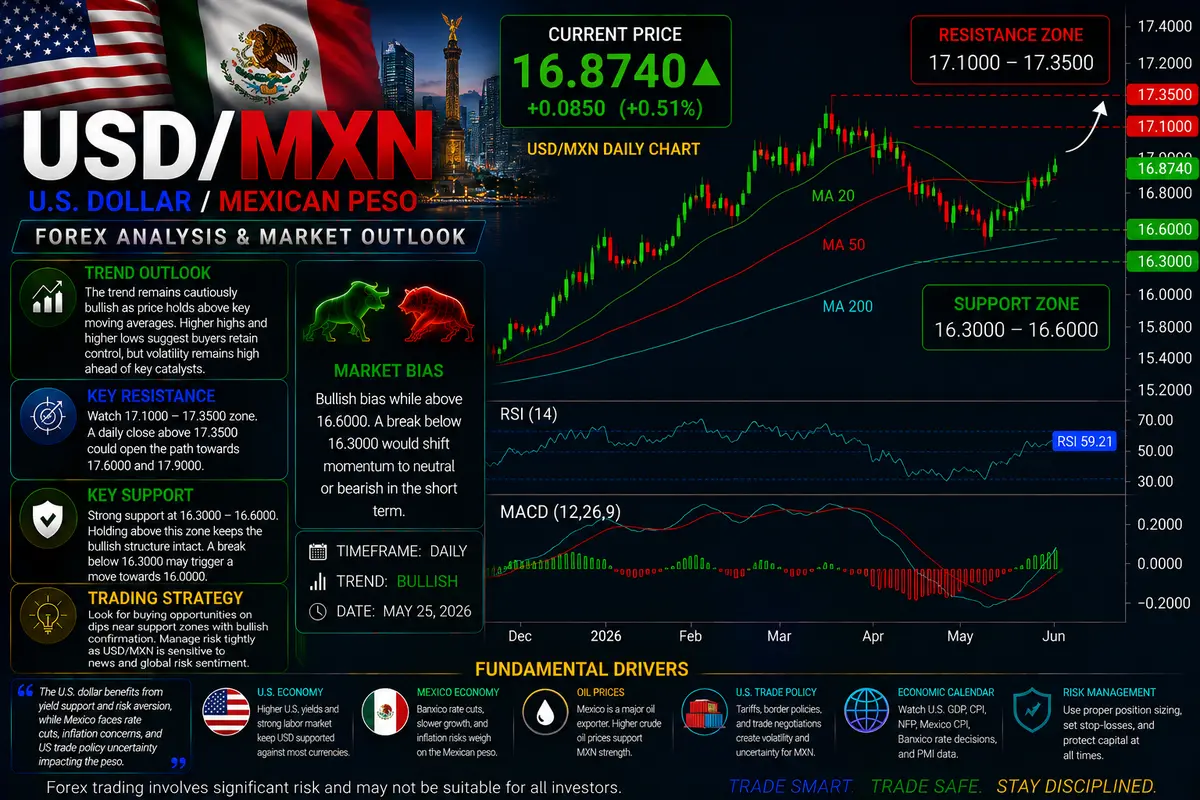
USD/MXN – Nearshoring Capital Capex, Inelastic Remittance Anchor, and Banxico Carry Mechanics

USD/MXN – Nearshoring Capital Capex, Inelastic Remittance Anchor, and Banxico Carry Mechanics

If you ask anyone running an emerging market FX desk where the real institutional volume is in Latin America, they will point you straight to the Mexican Peso. USD/MXN isn't just another regional cross. It's the most liquid currency pair in the Americas outside of the USD and CAD, serving as both a benchmark for global risk sentiment and a primary vehicle for yield-seeking capital.

What makes the Peso fascinating to trade right now is the tug-of-war between structural real-money inflows and short-term speculative carry positioning. To understand where this pair is heading over any meaningful horizon, you have to look past basic chart patterns and break down three specific economic forces: the industrial footprint of nearshoring, the constant buffer of family remittances, and the rate mechanics driving Banxico’s yield curve.

The Nearshoring Shift: Real Capital, Not Just Headlines

For decades, North American supply chains relied on long ocean routes from East Asia. But recent global trade frictions and logistics bottlenecks forced a massive structural pivot. Global manufacturing has been aggressively relocating capacity directly into northern and central Mexico—a trend widely known as nearshoring.

From an FX order book perspective, nearshoring translates into persistent, multi-year selling of US Dollars against the Peso:

  • Long-Term Capex Flows: When a international automaker, electronics manufacturer, or industrial firm builds a new facility in hubs like Monterrey, Saltillo, or Querétaro, they bring hard currency in Dollars. To pay for land acquisition, municipal permits, local construction contractors, and ongoing factory payroll, those corporate treasuries have to convert USD into MXN on spot desks.

  • Sticky Money: Unlike hot-money portfolio flows that enter and exit through liquid bond markets overnight, foreign direct investment in physical plants and equipment is illiquid and long-term. This ongoing conversion stream creates a structural floor beneath the Peso, dampening long-term upward spikes in USDMXN ...

Continue reading...
0
0
joy

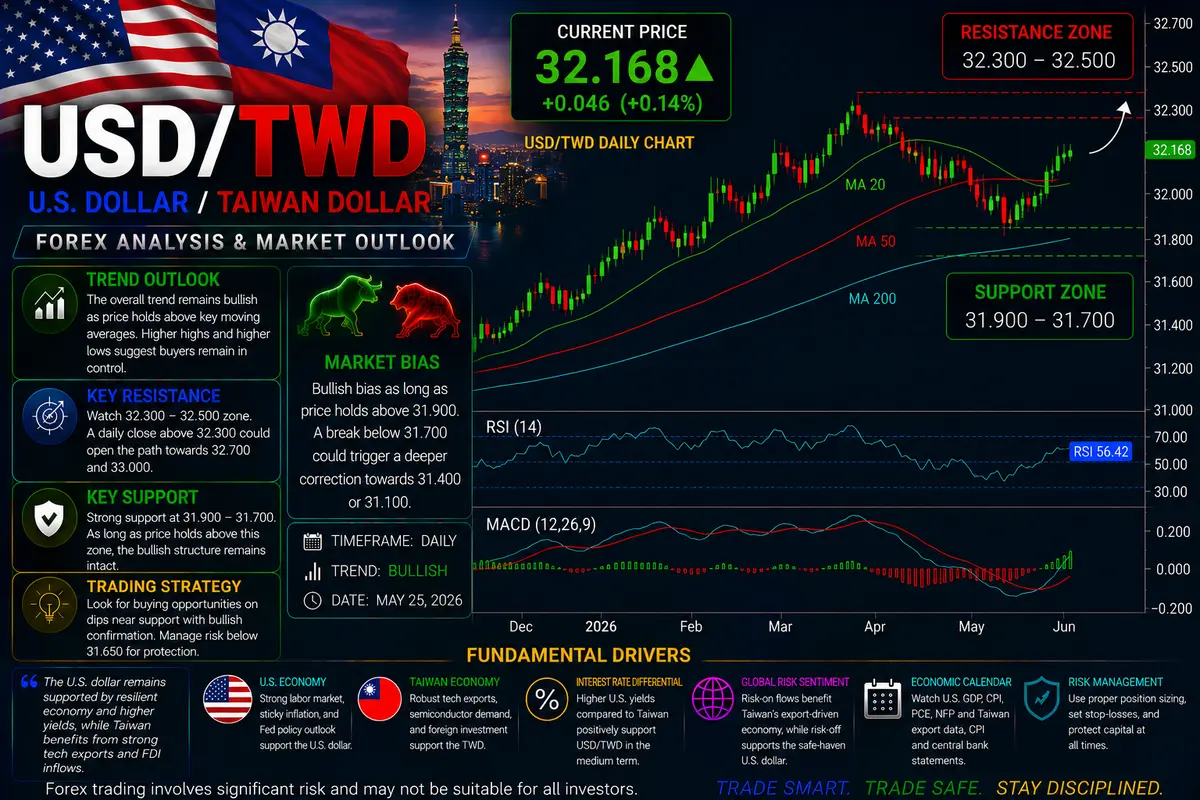
USD/TWD – Semiconductor Foundry Dominance, Life Insurance Outflows, and Central Bank Range Management

USD/TWD – Semiconductor Foundry Dominance, Life Insurance Outflows, and Central Bank Range Management

If you sit down with an Asian foreign exchange dealer in Taipei or Singapore and ask about trading the Taiwan Dollar, they will give you a straightforward reality: you are trading a proxy for the global technology hardware supply chain, bound tightly within a heavily managed central bank corridor.

Taiwan holds an extraordinarily dominant position in advanced microchip manufacturing. The island produces over 60 percent of the world's total semiconductors and over 90 percent of its highest-grade microchips. Because modern technology infrastructure—ranging from smartphone hardware and consumer electronics to artificial intelligence data centers and automotive computing systems—requires Taiwanese silicon, USD/TWD (US Dollar vs. Taiwan Dollar) sits right at the center of global trade flows.

However, trading USD/TWD requires navigating a dual-market environment. On one side, massive portfolio inflows into Taiwanese tech equities push the local currency higher. On the other side, structural capital outflows from domestic institutional investors and direct intervention by the Central Bank of the Republic of China (Taiwan) prevent the currency from moving too far, too fast.

1. The Core Engine: Foundry Export Orders and TAIEX Equity Flows

To understand how USD/TWD moves over multi-week and multi-month horizons, you have to look past standard macroeconomic indicators and track global technology expenditure alongside foreign institutional equity flows.

Taiwan’s economic growth is heavily concentrated in its semiconductor ecosystem. Anchored by foundry giant TSMC alongside a dense supply chain of integrated circuit design houses, chemical suppliers, testing specialists, and server assemblers, Taiwan's export performance moves in lockstep with global silicon demand.

This economic structure creates a direct mechanical relationship between technology earnings and spot foreign exchange order flow:

  • Expanding Global Tech Demand: When global tech companies ramp up hardware spending, orders flood into Taiwanese foundries. To participate in this hardware growth, offshore asset managers deploy capital into the Taiwanese stock...

Continue reading...
0
0
joy

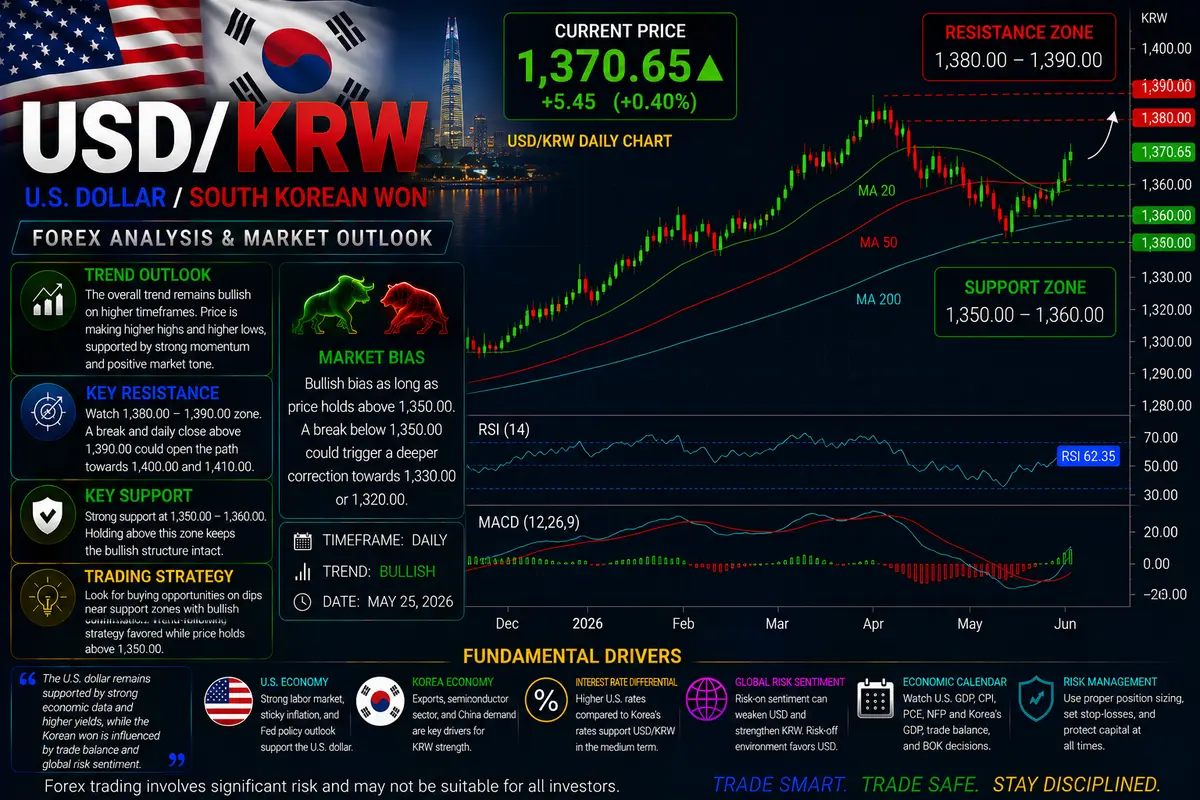
USD/KRW – Semiconductor Flows, the Capital Outflow Gap, and Bank of Korea Desk Dynamics

USD/KRW – Semiconductor Flows, the Capital Outflow Gap, and Bank of Korea Desk Dynamics

Ask anyone who has spent time running an Asian FX book about the Korean Won, and they’ll tell you the exact same thing: you aren't just trading a country's fiat currency. You're trading a real-time sentiment tracker on global tech hardware and AI infrastructure spending.

USD/KRW gives macro funds some of the cleanest exposure you can get to the global silicon cycle. South Korea sits right in the middle of the electronics supply chain, cranking out the DRAM, high-bandwidth memory (HBM), and specialized components that feed global tech builds. When tech capital expenditure surges, money hits Korean markets fast. When hardware demand cools off or tech stocks pull back, capital moves out just as quickly.

The Tech Export Paradox

In a simple textbook world, record-breaking tech exports should automatically drive the Won higher. But real-world institutional flows don't work like a textbook.

Look at how order flow actually hits the market:

Export Revenues Take Time to Convert

Tech giants like Samsung Electronics and SK Hynix generate massive dollar revenue streams when memory chip prices surge. But corporate treasuries don't dump all those dollars into the spot market at once. They hold offshore dollar cash piles, hedge their currency exposure, and time their conversions over extended windows.

Capital Outflows Act Fast

While export conversions trickle in slowly, foreign equity flows on the KOSPI and offshore retail investments move instantly. When domestic investors buy overseas shares or foreign funds liquidate local stock holdings, those spot orders clear immediately on dealing desks.

This creates sharp disconnects where chip exports hit record highs, yet USDKRW ... stays elevated or rallies anyway because structural capital outflows outrun daily export conversions.

Central Bank Intervention and the 00:00 UTC Window

The Bank of Korea (BOK) doesn't try to stop broad market trends, but they actively police speed and...

Continue reading...
0
0
joy

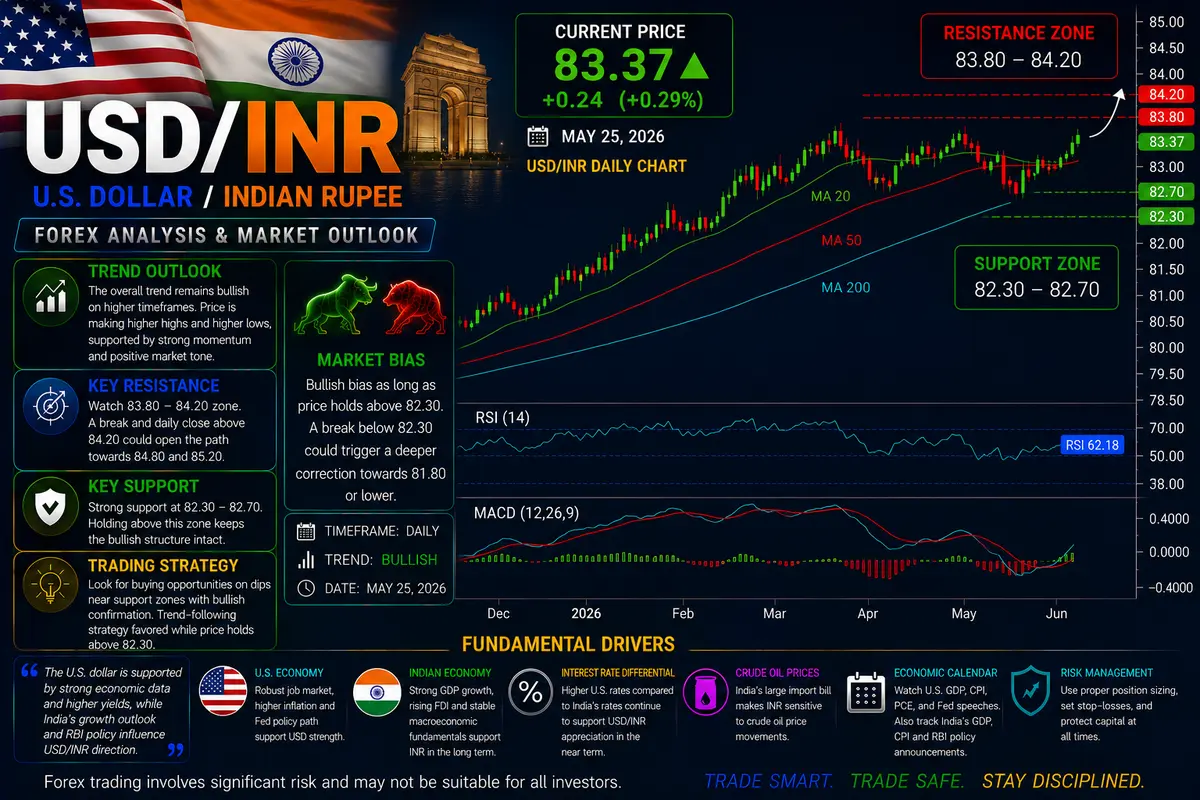
USD/INR – RBI Reserve Accumulation, Crude Import Burdens, and Offshore NDF Market Dynamics

USD/INR – RBI Reserve Accumulation, Crude Import Burdens, and Offshore NDF Market Dynamics

If you take a look at the USD/INR chart over almost any multi-month period, you’ll notice something strange compared to other emerging market currencies. Where pairs like USDZAR ... or USDMXN ... move in wide, jagged swings, USDINR ... trades in flat, horizontal steps separated by sudden, controlled shifts.

That isn't organic price discovery. It's the footprint of the Reserve Bank of India (RBI).

The Rupee operates under a managed float where the central bank acts as the dominant buyer and seller on the order book. To trade this pair profitably, you can't rely on standard technical breakouts. You need to understand how the RBI manages liquidity, how crude oil imports drive commercial dollar demand, and how offshore trading desks interact with the onshore market.

1. How the RBI Controls the Order Book

The Reserve Bank of India doesn't try to lock the currency to a fixed rate. Instead, its primary goal is to suppress intraday and weekly volatility.

This intervention style alters standard market behavior in two distinct ways:

  • Inflow Absorption: When international capital flows into Indian equities or corporate debt, the RBI steps in as a dollar buyer. By absorbing foreign currency, the central bank builds its reserve balance while preventing the Rupee from strengthening too quickly.

  • Outflow Smoothing: During global panics or oil price shocks, foreign capital leaves domestic markets. The RBI responds by selling dollars directly into the interbank market, supplying liquidity to meet import demands and dampening potential upside spikes.

Because the central bank operates as a counterparty on both sides of the market, momentum breakouts frequently fail. When price approaches obvious support or resistance zones, central bank intervention usually absorbs the volume, pushing price back into range-bound consolidation.

2. The Crude Oil Transmission Mechanism

India's current account balance has a permanent structural weakness: a heavy reliance on...

Continue reading...
0
0
joy

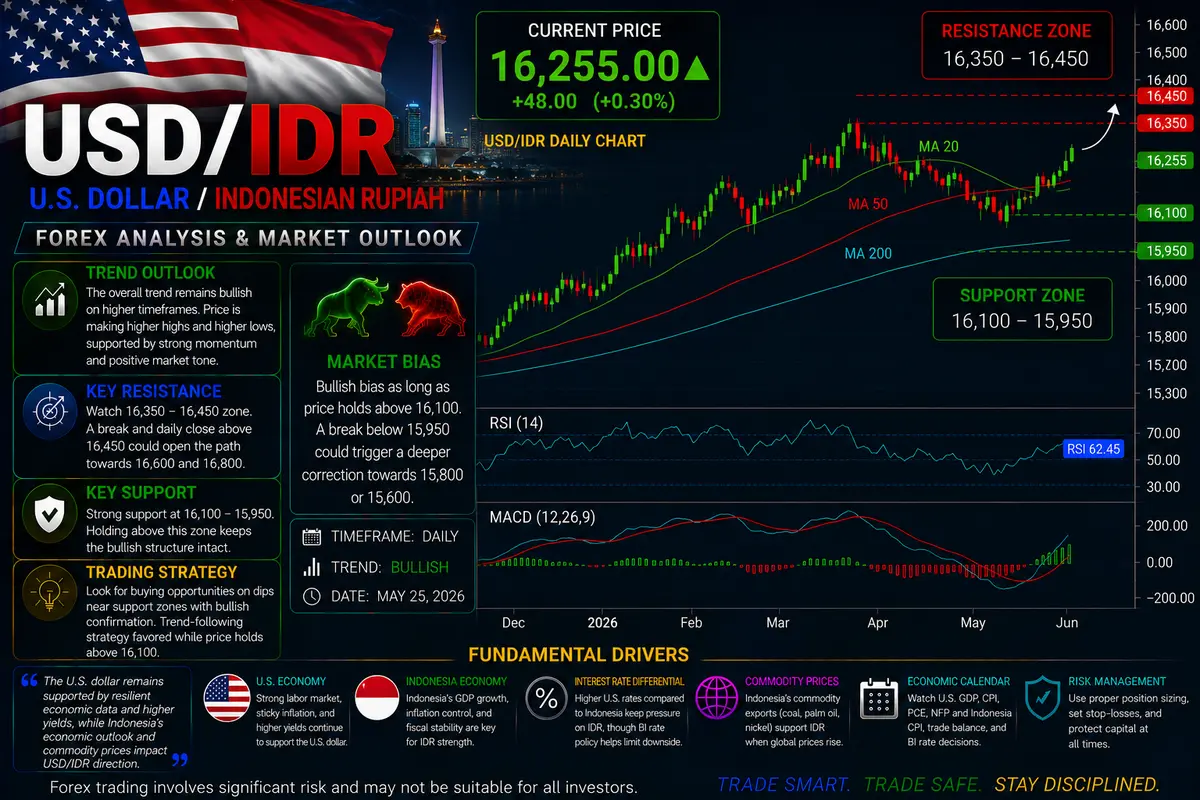
USD/IDR – Bank Indonesia’s Triple Intervention, Commodity Export Revenue, and High-Yield Bond Flows

USD/IDR – Bank Indonesia’s Triple Intervention, Commodity Export Revenue, and High-Yield Bond Flows

When trading emerging Asian FX on institutional desks, USD/IDR (US Dollar vs. Indonesian Rupiah) stands apart as a heavily managed, high-yield currency cross. Indonesia represents Southeast Asia’s largest economy, possessing vast reserves of critical industrial commodities alongside a high-yielding sovereign debt market that routinely draws foreign portfolio capital.

However, trading USD/IDR requires navigating a market where price action is strictly regulated by the central bank. Bank Indonesia (BI) enforces a hands-on stabilization framework designed to prevent currency volatility from disrupting domestic financial stability or sparking imported inflation.

1. Bank Indonesia’s Stabilization Mandate: The Triple Intervention Framework

Unlike G10 central banks that allow their exchange rates to float freely, Bank Indonesia actively manages the Rupiah through what dealing desks refer to as Triple Intervention.

When market turbulence or broad US Dollar strength pushes USDIDR ... toward key psychological barriers, Bank Indonesia intervenes simultaneously across three distinct financial channels:

By utilizing Domestic Non-Deliverable Forwards (DNDFs), BI allows domestic commercial banks to hedge forward Dollar exposure locally without draining physical foreign exchange reserves. When USD/IDR rallies too rapidly, aggressive spot intervention by BI regularly caps price action, turning sharp technical breakouts into range-bound consolidation phases.

2. Commodity Export Realities: Nickel, Coal, and DHE Regulations

Indonesia’s current account and foreign currency reserves are linked directly to its status as a major global commodity exporter—specifically in refined nickel, thermal coal, palm oil (CPO), and copper.

During global commodity expansions, Indonesian resource exporters accumulate billions in hard currency. To ensure these foreign earnings support domestic financial liquidity, the Indonesian government enforces strict export proceeds rules known as DHE (Devisa Hasil Ekspor):

  • Mandatory Retention: Exporters in natural resource sectors are required to retain at least 30% of their foreign exchange earnings in domestic financial accounts for a minimum of three months.

  • Impact on USD/IDR: When...

Continue reading...
0
0
joy

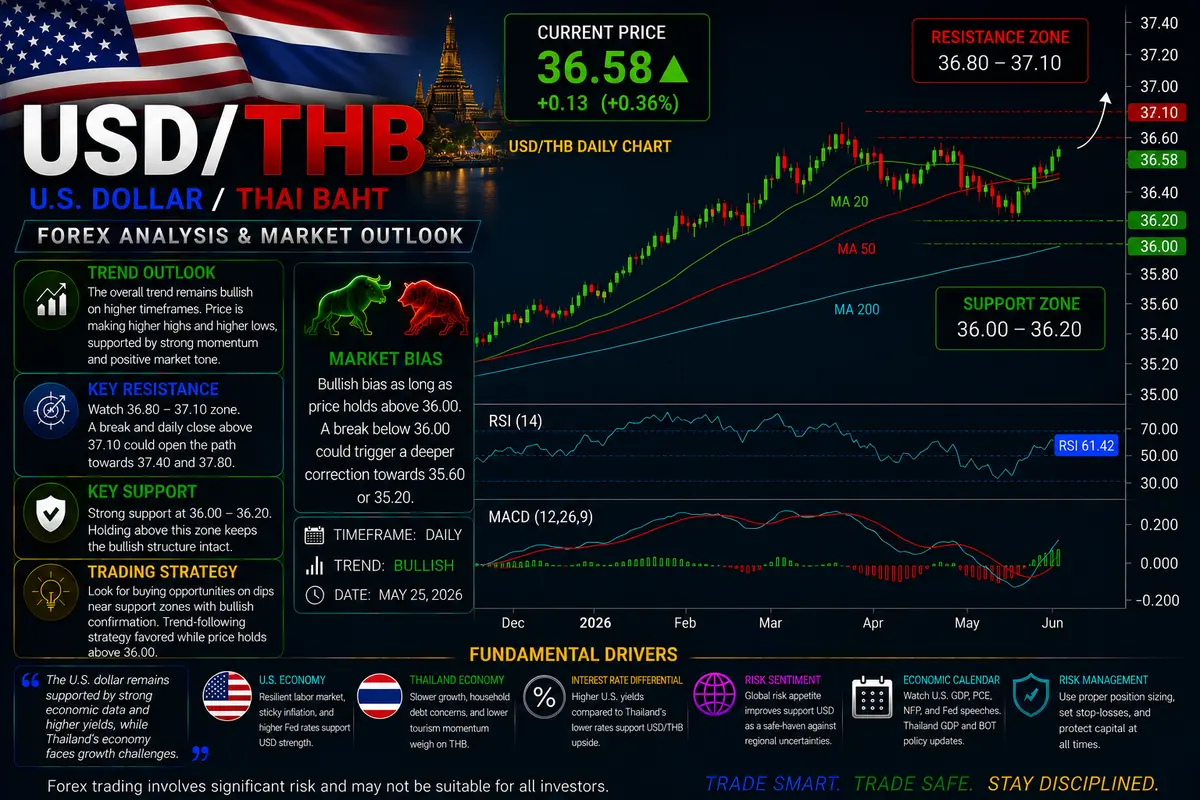
USD/THB – Tourism Capital Accounts, Gold Trade Anomalies, and Bank of Thailand Mechanics

USD/THB – Tourism Capital Accounts, Gold Trade Anomalies, and Bank of Thailand Mechanics

If you monitor emerging Asian currencies on institutional spot desks, USDTHB ... (US Dollar vs. Thai Baht) presents a structural profile that diverges sharply from its regional peers. While currencies like the Indonesian Rupiah (IDR) or Philippine Peso (PHP) move heavily on high-yield debt spreads and industrial commodity cycles, the Baht is anchored by a unique combination of tourism revenue inflows, physical gold trading dynamics, and aggressive central bank liquidity smoothing.

For macro traders, USD/THB is a highly liquid vehicle that offers clean directional trends when tourism flows align with global risk sentiment. However, navigating the order book requires understanding the specific microeconomic quirks that drive daily Baht conversions.

1. The Service Account Engine: Tourism Seasonality and Current Account Swings

Unlike heavily industrial Asian economies, Thailand’s current account balance is dominated by service exports—specifically international tourism.

Tourism accounts for a massive chunk of Thai Gross Domestic Product (GDP). This creates a distinct seasonal cycle on spot FX desks:

  • High Season (November – March): As millions of international visitors head to Thailand, foreign currency conversions surge. Tour operators, airlines, and hospitality networks dump foreign hard currency (USD and EUR) on local dealing desks to acquire Baht for domestic operational expenses. This sustained commercial demand creates a strong seasonal bid for the Baht, pushing USD/THB into multi-month downward trends.

  • Low Season (Monsoon Period / Q2–Q3): Tourism revenues contract significantly during the rainy season. At the same time, foreign corporate entities in Thailand remit annual dividends back to offshore parent companies. The net current account often flips into deficit, leaving USD/THB vulnerable to sharp upside rallies.

2. The Gold Market Paradox: Why XAU/USD Moves the Baht

One of the most distinctive features of the Thai market is the country’s obsession with physical gold. Thailand ranks among the highest per-capita physical gold consumption markets in...

Continue reading...
0
0
joy

USD/SGD – The S$NEER Policy Band & Trading the MAS Framework

Unlike almost every other major central bank that uses interest rates to manage monetary conditions, Singapore’s Monetary Authority of Singapore (MAS) controls its economy through the exchange rate. Because Singapore imports almost everything it consumes, domestic price stability is directly tied to the strength of the Singapore Dollar (SGD).

For Forex traders, USDSGD ... offers a unique setup where microeconomic fundamentals take a back seat to central bank policy band mechanics and Asian trade flows.

The MAS Framework: Baskets, Bands, and Crawls

The MAS manages the Singapore Dollar using an exchange-rate-based framework built on the S$NEER (Singapore Dollar Nominal Effective Exchange Rate).

Instead of targeting a single currency, MAS pegs SGD against an undisclosed trade-weighted basket of its major trading partners' currencies.

  • Slope: The rate of appreciation or depreciation of the band over time. A steeper slope signals tightening to fight imported inflation; a flat slope indicates neutral policy.

  • Width: The floor and ceiling range (typically estimated at $pm2%$) around the policy midpoint.

  • Midpoint: Re-centering the band up or down during sharp macroeconomic shocks.

Primary Price Drivers for USD/SGD

1. Fed vs. MAS Policy Divergence

While the Federal Reserve adjusts the Fed Funds rate, the MAS alters the slope, width, or center of the S$NEER band. When the Fed holds rates steady while MAS increases its appreciation slope, USD/SGD faces structural downward pressure.

2. China & Regional Trade Proxy

Singapore is a global financial and trade hub. Consequently, the Singapore Dollar functions as a high-liquidity proxy for regional Asian growth and trade volumes. USD/SGD shares a strong positive correlation with USD/CNH (+0.71 to +0.78). When Chinese economic performance accelerates, capital flows into Asian trade networks, typically strengthening SGD against USD.

3. Dual Safe-Haven Dynamics

Both currencies possess safe-haven attributes, but under different circumstances:

  • USD: Global risk-off sentiment (geopolitical crises, liquidity squeezes).

  • ...

Continue reading...
0
0
BCR

Daily Analysis 27 July 2026 | Fed Week Begins with Dollar Strength and Rising Energy Prices

Daily Analysis 27 July 2026 | Fed Week Begins with Dollar Strength and Rising Energy Prices

Currency & Commodity Analysis:


US Dollar Index


The dollar index traded near a three-week high of 101.54 last week as new tariffs imposed by US President Trump on major trading partners heightened concerns about the re-establishment of tariff barriers. Under the new framework, imports from countries including Mexico, Canada, the UK, and India will face a 10% tariff related to forced labor, while goods from the EU and Taiwan will be capped at 10%. Products from Japan, South Korea, and Switzerland will typically face tariffs as high as 12.5%, with additional charges on some goods. The dollar also received support as escalating tensions in the Middle East drove up energy prices, and the US labor market remained strong, with rising expectations of a tightening Federal Reserve policy. The swap market currently prices a roughly 34% probability of a Fed rate hike next week, fully pricing in at least one hike in September, with the possibility of another hike before the end of the year.


The dollar index, which tracks the dollar's performance against a basket of currencies, gave back some of its strong gains near its monthly high before the weekend. The index is currently trading in the 101.30-101.25 range, but downside appears limited in a constructive environment. The day's gains may be attributed to some profit-taking ahead of the weekend and some position-correcting ahead of next week's key FOMC policy meeting. However, any meaningful pullback remains unlikely, as persistently high oil prices continue to exacerbate inflation concerns and reinforce expectations of at least one more rate hike by the Federal Reserve. Furthermore, escalating tensions between the US and Iran and President Donald Trump's imposition of new comprehensive tariffs have dampened investor sentiment, potentially providing further support for the safe-haven dollar.


From a technical perspective, the...

Continue reading...
0
0

Exotic Currency Pair: Why Traders Avoid This Currency Pair.

Exotic Currency Pair: Why Traders Avoid This Currency Pair.

Exotic Currency Pairs: Why Many Nigerian Traders Avoid It At First

“Sir, I see one funny currency pair for my chart o.”

“Sir abeg, come explain this thing for us.”

Everybody for the class just turn head at once.

Chinedu don already half stand, dey point him laptop like say the thing go explode.

“I just open my MT5 this morning, I see USD/TRY. I even think say my app don spoil. Wetin be this one again?”

The whole class just burst laugh.

I just smile shake my head. “Relax, your app no get problem. That one na exotic currency pair.”

Another student quickly jump in, still dey confused.

“Sir, we don already learn major and minor pairs. So this one come from where again?”

I pick my marker, turn face the board.

“Forex market big pass wetin most beginners dey think. If na only EUR/USD and GBP/USD you know, you just dey see small corner of the market.”

---

What Are Exotic Currency Pairs?

“Make I break am down for simple way.”

Exotic currency pair na when one major currency pair with currency of developing or emerging country.

For example:

- USD/TRY – US Dollar and Turkish Lira

- USD/ZAR – US Dollar and South African Rand

- USD/MXN – US Dollar and Mexican Peso

- USD/THB – US Dollar and Thai Baht

- EUR/TRY – Euro and Turkish Lira

“So sir,” one student ask from middle, “Nigeria get its own pair?”

I laugh small.

“Not really. Nigerian Naira no dey common for most retail forex platforms. Na why you no dey really see USD/NGN like EUR/USD.”

Everybody just dey nod slowly like say things don dey clear small small.

---

Why Traders Dey Like Exotic Pairs?

One student for back raise hand.

“Sir, if these pairs no popular,...

Continue reading...
0
0
Navigation menu
instaforex banner