
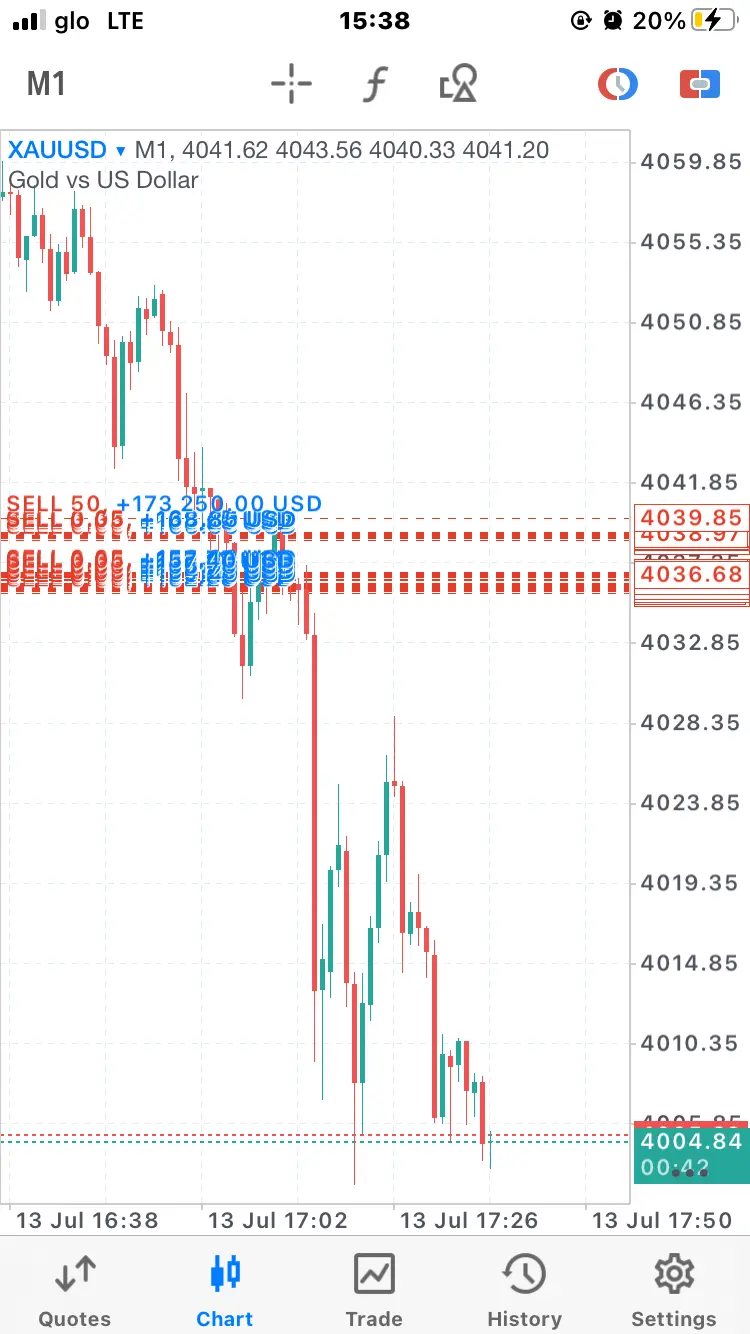
Master Market Imbalance & Fair Value Gaps: Trading Institutional Inefficiencies
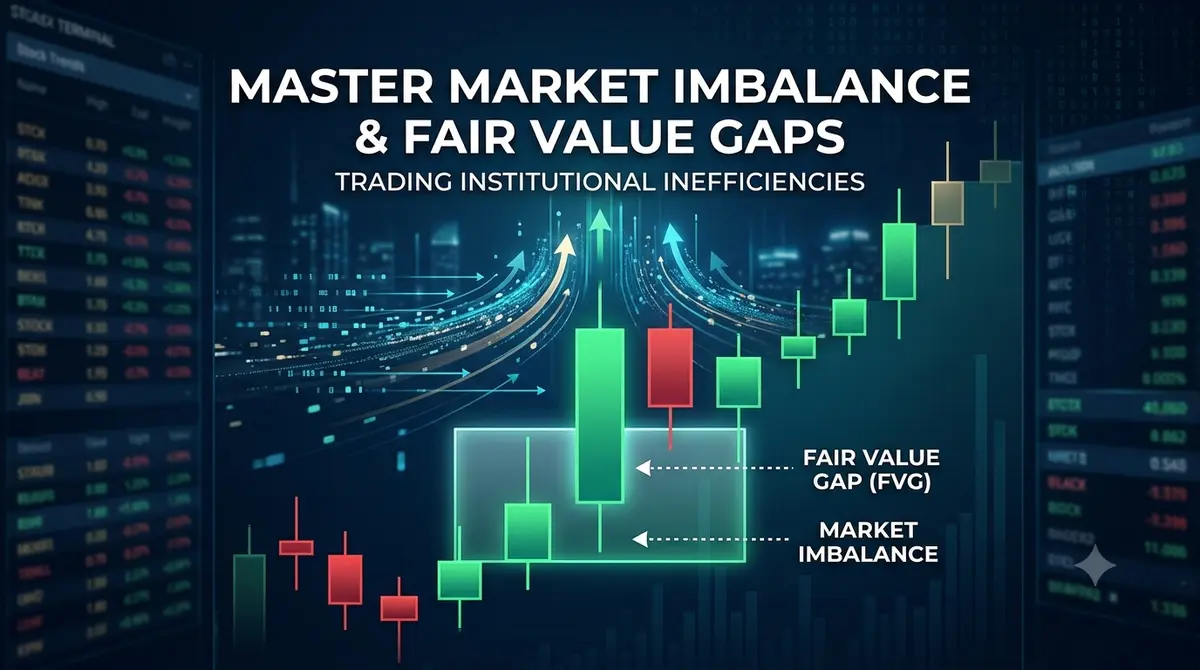
Master Market Imbalance & Fair Value Gaps: Trading Institutional Inefficiencies
We’ve all been there. You look at a chart, and out of nowhere, a massive green candle explodes upward. Panic sets in. You think, “If I don’t buy right now, I’m going to miss the whole move.” So you hit market buy at the top—and almost instantly, price turns around and slams straight back down.
That FOMO trap destroys more trading accounts than almost anything else.
Professional traders look at those violent moves totally differently. When a huge candle tears through a chart, it leaves behind an inefficiency—what traders call a Fair Value Gap (FVG) or market imbalance. Instead of chasing the spike, pros mark that zone and sit back. They know price almost always comes back to fill the gap before the real move continues.
What Actually Is a Fair Value Gap?
In a normal, healthy market, buyers and sellers trade back and forth smoothly. Price moves up a bit, down a bit, and fills orders at every single price level.
An imbalance happens when an overwhelming chunk of institutional money hits the market all at once. Think big bank orders, CPI news releases, or session open spikes. The buying or selling is so aggressive that price literally skips levels, leaving a big pocket of un-filled orders behind.
Spotting an FVG comes down to a simple three-candle pattern on your chart:
-
Bullish FVG: Find a big, aggressive green candle (Candle 2). Now look at the candle before it (Candle 1) and the candle after it (Candle 3). If the high of Candle 1 and the low of Candle 3 don’t overlap, that open gap in the middle is your bullish Fair Value Gap.
-
Bearish FVG: Find a strong red candle (Candle 2). If the low of Candle 1 and the high of Candle 3 don’t touch, the empty space between them is your bearish FVG.
Markets hate leaving work unfinished. These gaps act like open loops or magnets, pulling price back to rebalance those empty levels before the broader trend takes off again.
FVGs vs. Standard Chart Gaps
Don’t confuse Fair Value Gaps with regular market gaps:
-
Session Gaps: These are physical blank spaces on a chart where no trading happened at all because the exchange was closed (like stock market opening gaps or forex weekend gaps).
-
Fair Value Gaps (Imbalances): Trading was happening live, but it was so lopsided that price sprinted through without letting both sides participate fairly.
Think of an FVG like a house built in a rush. The frame is up, but the builder skipped painting and dry-walling. Before anyone moves in long-term, the crew has to come back and finish the job. That return trip is your entry setup.
How Imbalances Play Out Across Different Asset Classes
Because institutional algorithms run on order flow, imbalances show up across every single market:
-
Forex: Major news events like interest rate decisions or employment data launch huge 15-minute imbalances. Currency pairs love pulling back to rebalance those exact gaps later in the London or New York sessions.
-
Stocks & Indices: Futures like NASDX ... and USCL.TO ... leave clean FVGs during the chaotic first 30 minutes of the New York open. Waiting for that morning gap to fill usually gives you the safest entry of the entire day.
-
Crypto: Crypto markets move fast and run on leverage. Sudden liquidations leave massive daily and 4-hour imbalances on Bitcoin and Ethereum, providing clear reload zones during strong trends.
-
Options: Buying options right as price dips into a 4-hour FVG keeps you from paying inflated premiums. As price bounces out of the gap, you get rapid delta expansion without fighting heavy theta decay.

A Practical Rulebook for Execution
Trading FVGs isn’t about buying every gap you see on a 1-minute chart. To trade them with real consistency, follow a simple checklist:
-
Stack Your Confluence: Never trade a gap by itself. Look for FVGs that align with your higher-timeframe trend and sit inside an Order Block or right after a Liquidity Sweep.
-
Mark the 50% Level (Consequent Encroachment): Draw a box over the gap. The exact midpoint (50%) is called the Consequent Encroachment (CE). Price often dips right to that 50% line before snapping back in the trend direction.
-
Drop Timeframes for Confirmation: When price hits the gap, jump down to a 1-minute or 5-minute chart and wait for a local Change of Character (CHOCH) to confirm buyers or sellers are actually defending it.
-
Protect Your Account: Place your stop loss safely beyond the candle that created the gap. If price completely punches through the imbalance, the setup is invalid—get out and move on to the next one.
Once you learn to spot market imbalances, you’ll stop getting lured into FOMO breakouts and start entering trades right alongside institutional capital.



Comments
No comments yet. Be the first to share your thoughts!
Authentication Required
You must be logged in to post a comment.