XAUUSD Technical Outlook – 4 June 2026

Descending channel, the dominant structure since February peak
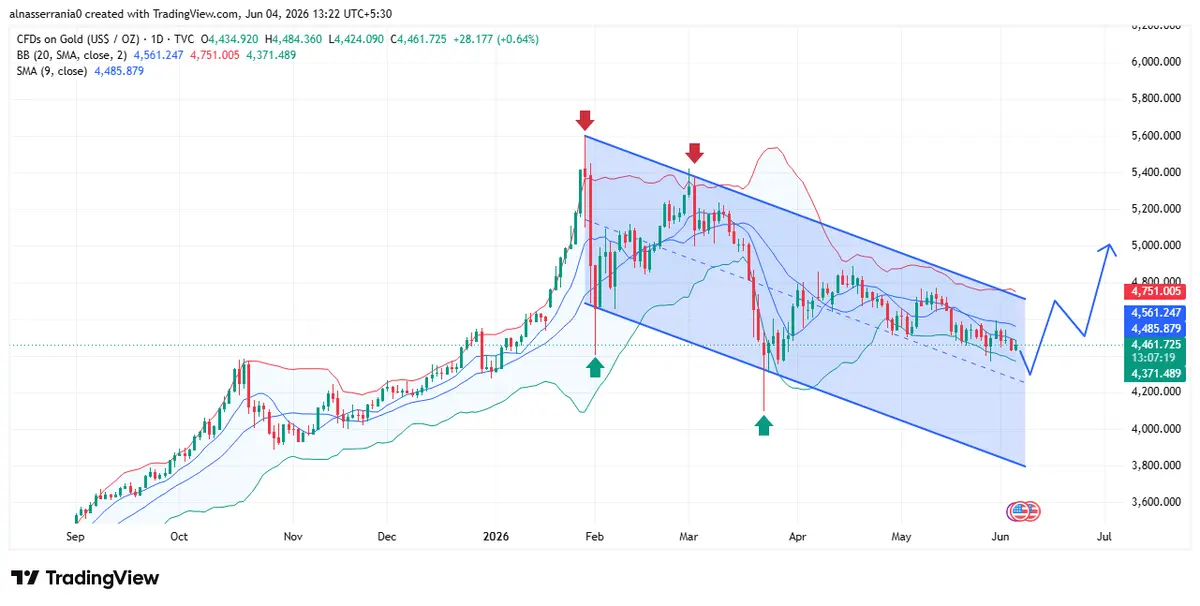
Gold peaked sharply near $5,500+ in early February 2026 and has been carving a clear descending channel (drawn in blue on the chart) ever since. Both the upper and lower channel lines are well-respected, price has tested both boundaries multiple times. The channel is sloping down from top-right to bottom-left, which tells you the sellers have been in control for 4+ months
Price is sandwiched, squeezed between channel support and SMA9
At $4,461, price is sitting right at the lower boundary of the descending channel a historically significant bounce zone. Both prior green arrows on the chart (February and March) marked rebounds from this exact region. The SMA9 ($4,485) is overhead acting as immediate dynamic resistance. Price needs to close above SMA9 on a daily basis to even hint at recovery. Until that happens, this is a range-bound squeeze with downside risk still alive.
Key Levels to watch
-
Channel top / BB upper – $4,751 Major resistance — unlikely near-term
-
SMA20 midline – $4,561 Bears defend this level
-
SMA9 dynamic resistance – $4,485 Immediate ceiling today
-
Current price – $4,461 At channel lower support
-
BB lower / channel floor – $4,371 Critical support — bounce or break
-
Breakdown target – $3,800 If $4,371 fails decisively

Comments
No comments yet. Be the first to share your thoughts!
Authentication Required
You must be logged in to post a comment.