

I Started Learning Technical Analysis. The Chart Stopped Being Just a Picture.
Hi, this is NorthRay.😎
For a long time, I looked at charts like abstract art.
Red candles, green candles, lines crawling somewhere across the screen. I understood where the price moved, but I didn’t understand WHY it moved there or WHERE it might go next.
I traded randomly. I clicked Buy because “I feel like it’ll go up.” I clicked Sell because “it seems too high.”
That worked about half the time. Because honestly, both I and my cat could flip a coin.
And then I told myself: “Enough guessing. Time to understand.”
That’s when I started learning technical analysis.
What I Used to Think About Technical Analysis (and How Wrong I Was)
Honestly? I thought it was something complicated and unnecessary.
“Why do I need all these lines and patterns? The market is chaotic. News and crowd emotions decide everything.”
I was wrong.
Yes, news matters. Yes, emotions drive the crowd. But all of that is REFLECTED on the chart. Price doesn’t come out of nowhere. It’s created by the actions of thousands of traders.
And those actions have patterns.
Technical analysis isn’t magic. It’s simply an attempt to find repeating patterns on a chart and use them to make forecasts.
In simple terms:
If every time the price touches a certain level it bounces upward, that’s not a coincidence. It means buy orders are sitting there.
Technical analysis helps identify those levels.🔥
Where I Started (Slowly, Without Overdoing It)
I didn’t try to learn everything at once. I have no goal of becoming a professor.
I decided to master three basic things that, according to experienced traders, cover 80% of a beginner’s needs.
My minimum program:
-
Support and resistance levels
-
Trend lines
-
One confirmation indicator (for me it’s the Stochastic oscillator, which I already wrote about)
That’s it. Everything else can come later.✍️
What Support and Resistance Levels Are (The Simplest Explanation)
This was the first thing I learned. And it actually works.
Support is a level below which the price doesn’t want to fall.
Imagine a floor. Price hits it and bounces upward.
Resistance is a level above which the price doesn’t want to rise.
Imagine a ceiling. Price hits it and bounces downward.
How I Draw Levels
I open a chart (H1 works best for me). I look for places where the price reversed 2–3 times. Then I draw a horizontal line.
That’s it. Level ready.
My Current Strategy
-
Price approaches support → I look for a Buy
-
Price approaches resistance → I look for a Sell
Then I wait for confirmation from the Stochastic. If both signals point in the same direction, I open a trade.📐
What Trend Lines Are (and Why They Matter)
Levels are horizontal lines. A trend is the direction of movement.
There are three types of trends:
Uptrend (Bullish)
Price moves upward. We draw a line along the lows from below.
Downtrend (Bearish)
Price moves downward. We draw a line along the highs from above.
Sideways Market (Range / Flat)
Price moves back and forth inside a range. Regular support and resistance levels work well here.
What I Learned About Trends
Trading with the trend is easier and safer.
If the trend is bullish, Buy signals work more often.
If the trend is bearish, Sell signals work more often.
Whenever I traded against the trend (“price is too high, it has to fall now, I’m opening a Sell during an uptrend”), I usually lost.
Now my rule is simple: first identify the trend, then look for signals in its direction.⏰
How I Apply This in Practice (A Real Example)
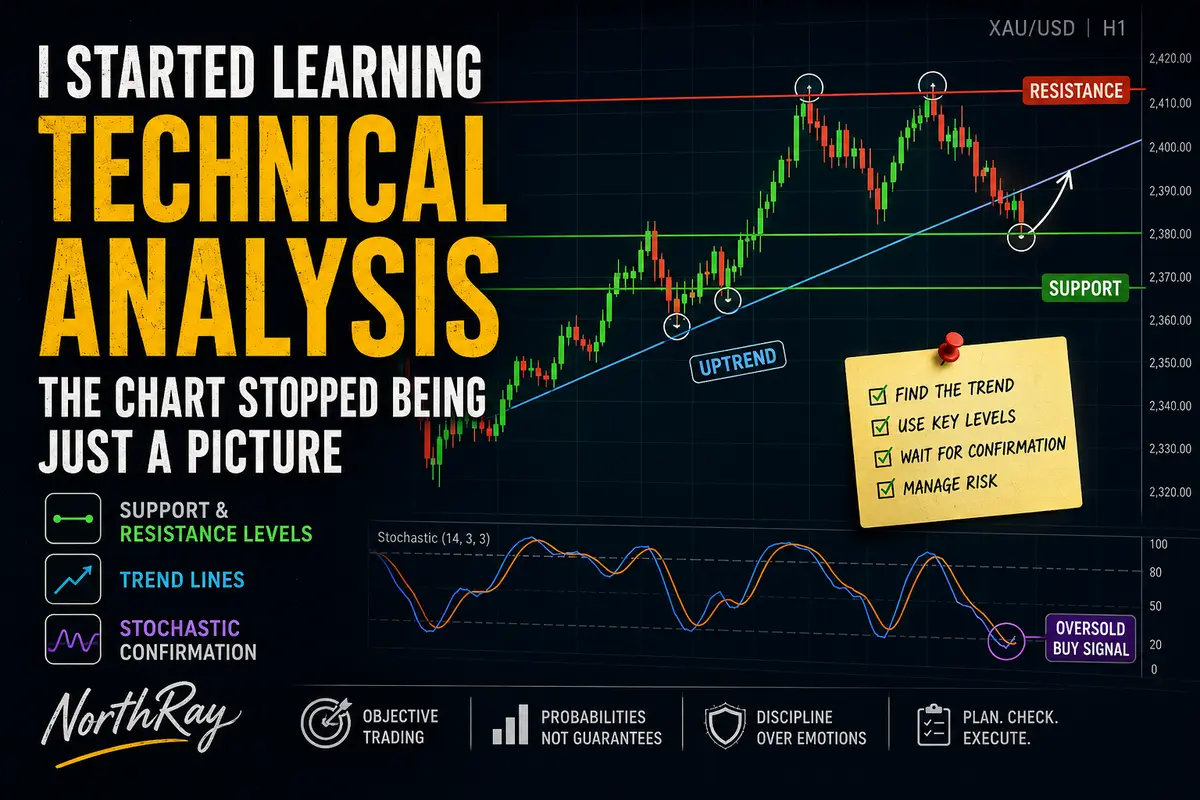
Yesterday I was watching gold (XAU/USD).
Step 1: Identify the Trend
On the H1 chart, price had been rising for several days. Uptrend confirmed.
Step 2: Draw Support
Price bounced twice from the same lower level.
Step 3: Wait for the Stochastic Signal
Price approached support. The Stochastic was in the oversold zone (below 20) and started turning upward.
Step 4: Open the Trade
I opened a Buy position. 0.10 lot. Stop-loss slightly below support. Take-profit near the closest resistance level.
Result
The trade closed with a profit of $18.30.
Not huge money, but the important part is this: I didn’t enter randomly. I had reasons.
That’s what matters.📝
My Mistakes While Learning Technical Analysis (Of Course There Were Some)
Mistake #1: Trying to Learn Everything at Once
During the first week, I opened 10 tabs with patterns, indicators, and chart formations. My brain melted. I remembered nothing.
Solution:
I slowed down. One topic per week. First levels. Then trends. Then the Stochastic. Once I master those, I’ll add something new.
Mistake #2: Drawing Levels Where I Wanted Them to Be
I looked at the chart and thought: “There SHOULD be a level here.” Drew a line. The trade failed.
Solution:
Levels should exist where price ACTUALLY reversed. Not where I want them to be.
Mistake #3: Trusting Every Signal
Saw a level + a Stochastic signal = opened a trade. Sometimes it still failed.
Solution:
Even good signals don’t guarantee profitable trades. I added another filter: I check the higher timeframe (D1). If the overall trend matches my signal, I enter. If not, I skip it.🥳
What I Realized Today
First:
Technical analysis is not magical prediction. It’s probability management.
I can be wrong in 40% of my trades and still stay profitable if I manage risk correctly.
Second:
The chart is the language of the market.
Technical analysis teaches me how to read that language. Not perfectly, but at least I’m no longer blindly guessing.
Third:
You don’t need to know 50 indicators and 100 patterns.
A few simple tools used with discipline are enough.🤫
My Technical Analysis Learning Plan (For the Next Few Weeks)
-
Strengthen my understanding of levels and trends — keep drawing them on every chart before opening a trade
-
Dive deeper into the Stochastic — learn divergences (when price and indicator move differently). People say it’s a powerful signal
-
Add one candlestick pattern — for example, the pin bar (a candle with a long wick). Simple and clear
-
Start tracking statistics — how many signals worked, how many failed, and under what conditions signals become stronger
What’s Next
— I’ll continue trading using the “levels + trend + stochastic” system.
— I’m collecting statistics and will post intermediate results in a couple of weeks.
— If people are interested, I’ll write a separate post about how I search for entry points (my checklist before every trade).
If you also used to look at charts like a chaotic mess of candles and had no idea where to enter — start with levels.
It’s simple. It works. It gives you structure.
Technical analysis won’t make you a millionaire in a month. But it can turn you into a trader instead of a gambler.
— NorthRay
(with a chart covered in horizontal lines, a trend line, and a stochastic indicator at the bottom — and now it doesn’t look scary anymore)💪

Comments
No comments yet. Be the first to share your thoughts!
Authentication Required
You must be logged in to post a comment.