Why the Chart Looks Like a Christmas Tree and Why People Put Lines on It (My First Indicator — Stochastic)

Hi, this is NorthRay.
For a long time, I looked at a clean chart. Just candles. No lines. No colorful bands. Pure simplicity.
I used to think: “Why would I need indicators? I can already see the market.”
Then I realized I wasn’t seeing everything.
Trader friends in chat rooms would say things like: “Stochastic is overbought,” “RSI shows divergence,” “The moving average got broken.”
I nodded and pretended to understand, but inside I was thinking: “What are you even talking about?”
So I decided to figure it out.🔎
What Indicators Are in Simple Terms
An indicator is a mathematical formula that draws an extra line (or histogram, or zones) on the chart to help you make decisions.
It does not predict the future. Remember that once and for all.
It simply processes past price data and displays it in a convenient form.
Here’s a simple analogy:
You look at the thermometer outside your window. It says -10°C. You think: “It’s cold outside, I should wear a jacket.”
The thermometer doesn’t predict tomorrow’s weather. It just tells you what’s happening now. The decision is yours.
An indicator is basically a thermometer for the chart. It says: “The market is overheated right now,” or “The market is too cold right now.” What you do with that information is up to you.💬
Why Use Indicators at All (If You Can Just Watch Candles)
I asked myself that question too. Here’s what I came up with.
Three reasons:
1. Indicators Help Remove Emotions
When I only look at candles, my eyes can deceive me. One candle looks huge and scary. It feels like the whole market is about to collapse.
An indicator gives an objective number. For example: “Stochastic shows 85 — this is an overbought zone. Statistically, price is more likely to move down.”
I trust numbers more than my frightened eyes.
2. Indicators Show Things You Can’t Easily See
For example, divergence.
That’s when price makes a new high, but the indicator makes a lower high. It can signal that the trend is weakening and may reverse soon.
You don’t always notice that with the naked eye. The indicator highlights it.
3. Indicators Give Entry and Exit Points
I don’t have a super strategy yet. But an indicator can suggest: “A bounce is more likely here,” or “Better stay out for now.”
Why I Chose Stochastic as My First Indicator
There are hundreds of indicators. I simply searched: “Most popular indicators for beginners.”
The top results were: Moving Average, RSI, MACD, Bollinger Bands, and Stochastic.
I chose Stochastic.
Why?
Because, as people explained to me, it shows overbought and oversold zones.
Overbought: Price has risen too far and too fast. Time to sell? (Sell)
Oversold: Price has fallen too far and too fast. Time to buy? (Buy)
Sounds logical. Buy low, sell high. And Stochastic helps define what “low” and “high” mean mathematically.✍️
How Stochastic Works (Simple Explanation)
Stochastic compares the current closing price to the price range over a selected period.
It draws two lines moving between 0 and 100.
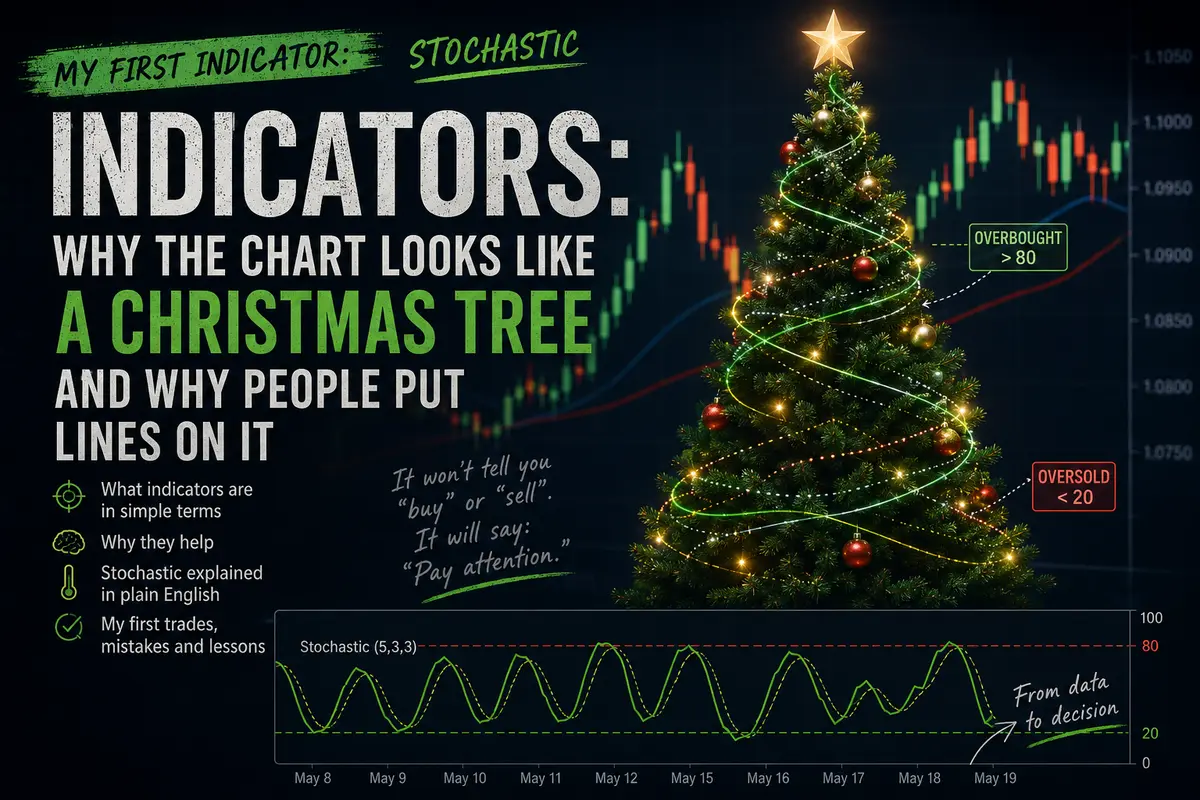
If the lines are above 80 — it’s the overbought zone. Price may be too high, and a downward correction could come soon.
If the lines are below 20 — it’s the oversold zone. Price may be too low, and a bounce upward could happen soon.
What I do with this knowledge (for now, in theory):
-
When Stochastic exits the overbought zone (crosses below 80) — I consider a Sell.
-
When Stochastic exits the oversold zone (crosses above 20) — I consider a Buy.
Sounds simple? Too simple. There’s probably a catch. And I’m going to find it.😱
How I Added Stochastic to MetaTrader 4
Turns out, it’s easy.
Step by step:
-
Right-click on the chart (where the candles are).
-
Choose “Indicators List” → “List” (or simply “Insert Indicator”).
-
Open the “Oscillators” folder.
-
Select “Stochastic Oscillator.”
-
Press OK (I kept the default settings for now: %K=5, %D=3, slowing=3).
A small window appears under the chart with two moving lines.
Done. My first indicator on the chart.
The chart stopped being perfectly clean. Now it looks like a “Christmas tree” — but it’s my Christmas tree.💪
What I Saw and How I Tried to Use It
I opened EUR/USD on the H1 timeframe (1 hour). Then I watched the Stochastic.
First observation:
When the lines were above 80, price often turned downward afterward. Not always, but often.
When the lines were below 20, price often bounced upward. Again, not always, but enough to catch my attention.
My first test (carefully, on demo):
I saw Stochastic enter the oversold zone (below 20) and start turning upward.
I opened a Buy on EUR/USD, 0.10 lots. Set a small stop-loss.
The trade closed with a small profit. I got excited. Then I opened another trade using the same signal — and it closed at a loss.
Conclusion: Stochastic does not give 100% accurate signals. Sometimes it lies. But combined with something else (like a support level), it can be useful.😎
My First Mistakes with Stochastic (So You Don’t Repeat Them)
Mistake #1: Thinking “Above 80” Means “Sell Immediately”
No.
Stochastic can stay above 80 for a long time while price keeps rising. The market can remain “overbought” for weeks.
Correct approach: Wait until Stochastic starts turning and exits the 80 zone from top to bottom. Only then consider it a signal.
Mistake #2: Ignoring the Trend
If the overall trend is bullish and Stochastic shows overbought conditions, it may not be a Sell signal. The market could simply be “resting” before continuing upward.
Correct approach: First identify the trend. If the trend is up, Buy signals from the 20 zone are generally more reliable than Sell signals from the 80 zone.
Mistake #3: Trading Small Timeframes (M5, M15)
On smaller timeframes, Stochastic produces a lot of noise and false signals.
I got frustrated and lost money (demo money, but still painful).
Correct approach: Start with H1 or higher. Signals are usually cleaner there.
What I Learned Today
First: Indicators are not magic. They are tools. Like a hammer. You can use it to drive a nail — or smash your finger. It all depends on the hands using it.
Second: Stochastic is a good beginner indicator. It’s understandable, popular, and its signals are easy to interpret. But it’s not the holy grail.
Third: No indicator replaces stop-losses and risk management. Even if Stochastic gives a signal, the market can still move against you.🤔
My Plan with Stochastic Going Forward
I’ll keep testing Stochastic on demo accounts and collecting statistics: how many signals worked and how many failed.
I’m trying to combine Stochastic with support and resistance levels (which I draw manually). If the signal matches a level, I trust it more.
I’m not trading based only on Stochastic. I’m looking for confirmation on the chart.
If things go well, I’ll add a second indicator soon (probably Moving Average, to better understand the trend).
What’s Next
-
Continuing to monitor my open SPX trade.
-
Planning to finally open Apple during regular market hours (didn’t forget).
-
Studying Stochastic more deeply — settings, different modes, divergences.
If you were also afraid of indicators and didn’t understand why people use them — start with Stochastic. It’s beginner-friendly.
But remember the main thing:
An indicator will never tell you “buy” or “sell.”
It will only say: “Pay attention.”
The decision is always yours.🍻
— NorthRay
(with the first indicator on the chart, green Stochastic lines at the bottom, and the understanding that this is only the beginning of the journey into technical analysis)

Comments
No comments yet. Be the first to share your thoughts!
Authentication Required
You must be logged in to post a comment.