

USD/NOK – North Sea Crude Dynamics, Norges Bank Policy, and Sovereign Wealth Capital Flows
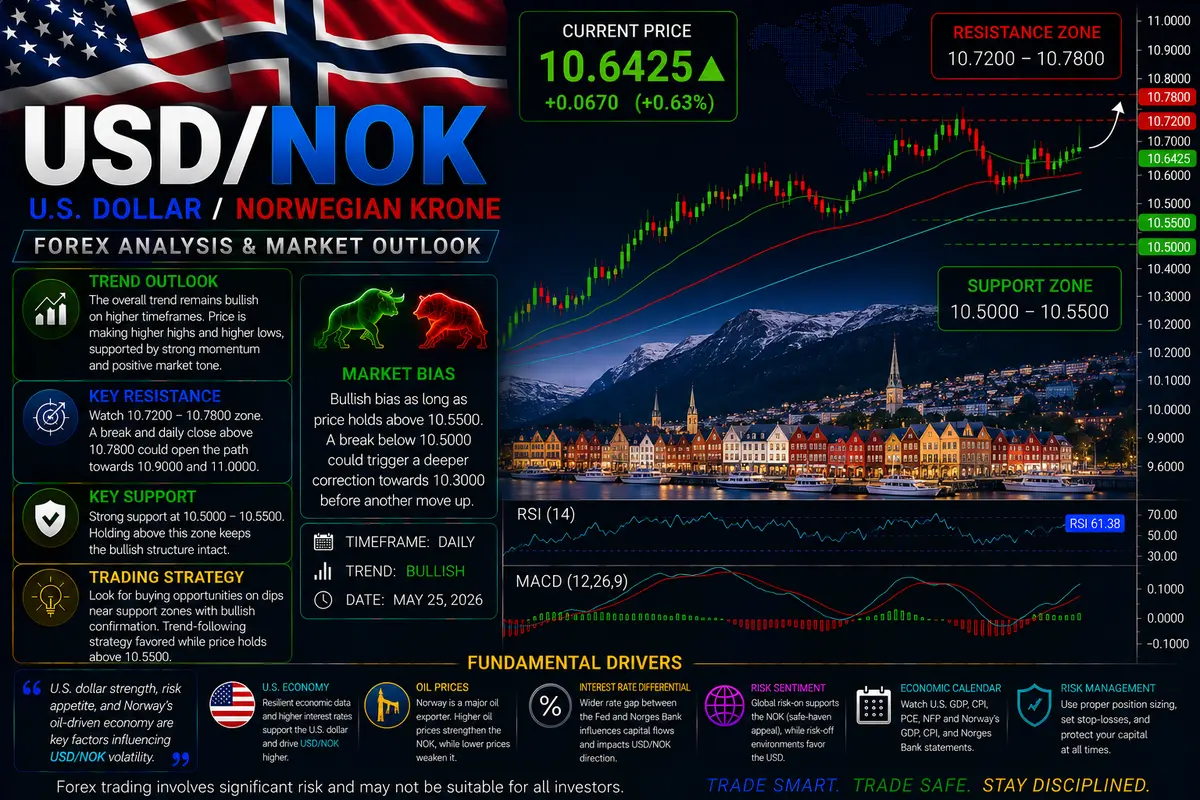
Among energy-linked currency pairs in developed markets, USDNOK ... (US Dollar vs. Norwegian Krone) holds a unique position. While major commodity crosses like USDCAD ... or AUDUSD ... feature heavy retail participation, USD/NOK trades primarily as an institutional vehicle for energy supercycles, Western European macro health, and active central bank liquidity management.
The Norwegian Krone represents a G10 economy with an enviable sovereign balance sheet. Backed by Western Europe’s largest oil and natural gas producer and anchored by the multi-trillion-dollar Government Pension Fund Global (GPFG), the Krone combines rock-solid fiscal backing with extreme sensitivity to global energy benchmarks. For institutional trading desks, USD/NOK is the ultimate liquid proxy for European energy sentiment and global risk appetite.
1. The Core Engine: North Sea Energy Markets and Crude Correlations
To understand the macro forces driving USD/NOK over multi-month horizons, you must start with energy markets—specifically Brent Crude and European natural gas benchmarks (TTF).
Norway’s current account surplus and export revenues are tied directly to offshore oil and gas production in the North Sea. When global energy demand surges or supply disruptions push Brent crude prices higher, Norwegian energy giants generate massive hard-currency windfalls.
This revenue cycle creates a distinct mechanical flow on spot FX dealing desks:
-
Energy Boom Phase: Rising crude and natural gas prices boost Norway’s trade surplus. Energy producers sell foreign currency (USD and EUR) on spot desks to buy Krone in order to settle local tax obligations, fund offshore capital expenditures, and pay domestic suppliers. This ongoing commercial conversion builds a persistent, real-money floor beneath the Krone, driving USD/NOK into sustained downward trends.
-
Energy Slump Phase: When global energy prices drop due to oversupply or global recession fears, Norway’s trade revenues contract. Commercial demand for the Krone weakens significantly, and institutional investors reallocate capital into US Dollar cash, sending USD/NOK climbing rapidly.
However, experienced traders know the crude correlation is asymmetric. During acute “risk-off” panics across global markets, the general flight to the safe-haven US Dollar often overpowers a temporary rally in crude oil, causing USD/NOK to spike upward regardless of short-term energy ticks.
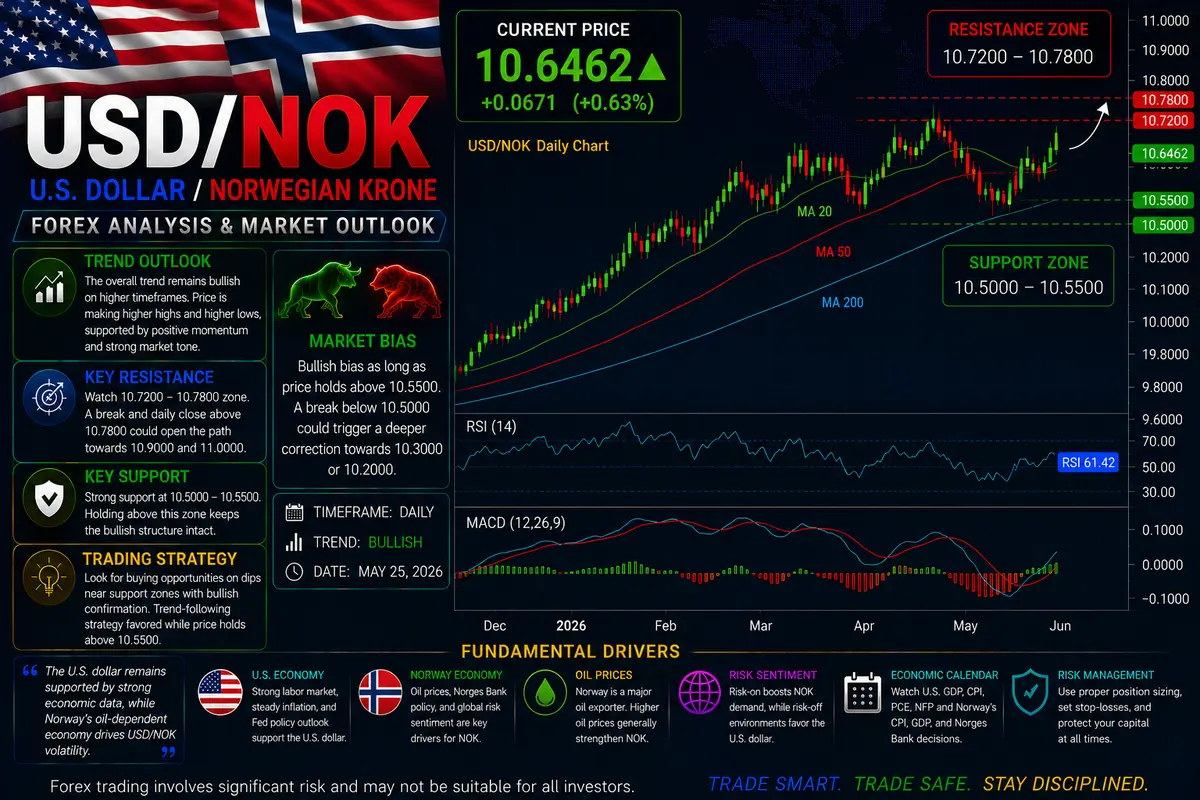
2. Norges Bank Operations and Fiscal Krone Sales
Monetary policy set by Norway’s central bank—Norges Bank—acts as a primary driver of short-term interest rate differentials and intraday liquidity in USD/NOK.
Norges Bank has earned a reputation for maintaining a disciplined, hawkish stance on inflation, frequently keeping its policy rate elevated relative to European peers. However, the central bank plays a unique dual role that directly impacts daily order flow: it manages daily commercial FX transactions on behalf of the Norwegian government.
Because Norwegian energy companies pay their corporate taxes in Krone, they must purchase large volumes of NOK on the open market. To prevent these tax payments from creating artificial liquidity squeezes or over-appreciating the currency, Norges Bank executes daily FX transactions—selling Krone on behalf of the state to transfer excess capital into foreign currency for the Sovereign Wealth Fund (GPFG).
Norges Bank FX Flow Transmission:
+---------------------------------------------------------------------+
| High Energy Revenues  ---> Energy Firms Buy NOK to Pay Local Taxes
|                       ---> Norges Bank Sells NOK Daily for GPFG Fund
|                       ---> Balanced Commercial Order Book on USD/NOK
+---------------------------------------------------------------------+
| Low Energy Revenues -> Tax Inflows in NOK Decrease
|                     -> Norges Bank Reduces or Pauses Daily NOK Sales|
|                     -> Tightening NOK Supply Triggers Fast Rallies|
+---------------------------------------------------------------------+
When Norges Bank announces adjustments to its daily Krone buying or selling amounts at the start of each month, dealing desks react immediately. A surprise reduction in daily NOK sales reduces market supply, triggering sudden bullish runs for the Krone against the US Dollar.
3. Sovereign Wealth Fund Rebalancing and High-Beta Risk
The sheer scale of Norway’s Sovereign Wealth Fund—holding over $1.5 trillion in global equities, fixed income, and real estate—creates a secondary structural flow that influences USD/NOK during major market swings.
The fund operates under strict asset allocation mandates. When global equity markets experience major rallies or sell-offs, the fund must periodically rebalance its portfolio back to target weightings.
During global market panics, international investors treat the Norwegian Krone as a high-beta cyclical asset rather than a defensive safe haven. Despite Norway’s pristine sovereign balance sheet and zero net government debt, capital flees small, open-market currencies during periods of high market volatility (elevated VIX). Offshore asset managers dump NOK holdings in favor of deep US Dollar liquidity, causing USD/NOK to experience aggressive, vertical upside spikes that skip past minor technical support levels.
Desk Execution and Strategy Guidelines
To trade USD/NOK effectively while managing execution costs and intraday volatility, follow three essential desk rules:
-
Execute During the European/US Overlap: The highest market depth and tightest spreads occur between 08:00 and 16:00 UTC, when Oslo, London, and New York dealing desks are fully active. Spreads widen noticeably during the late Asian and quiet overnight trading hours.
-
Track Brent Crude & TTF Gas Prices: Always keep real-time charts of Brent crude oil and European natural gas open alongside USD/NOK. A sharp breakout in energy futures often provides a leading signal for directional momentum in the Krone.
-
Size Position for Pip Volatility: USD/NOK trades at higher nominal exchange values than standard G10 majors like EUR/USD or GBP/USD, with daily ranges routinely spanning 500 to 1,000 pips during active sessions. Always calculate position sizing based on net percentage risk limits rather than fixed pip-stop distances.

Comments
No comments yet. Be the first to share your thoughts!
Authentication Required
You must be logged in to post a comment.