XAUUSD May 6, 2026: Gold Battles for $4700, But the Risk Pendulum Still Swings
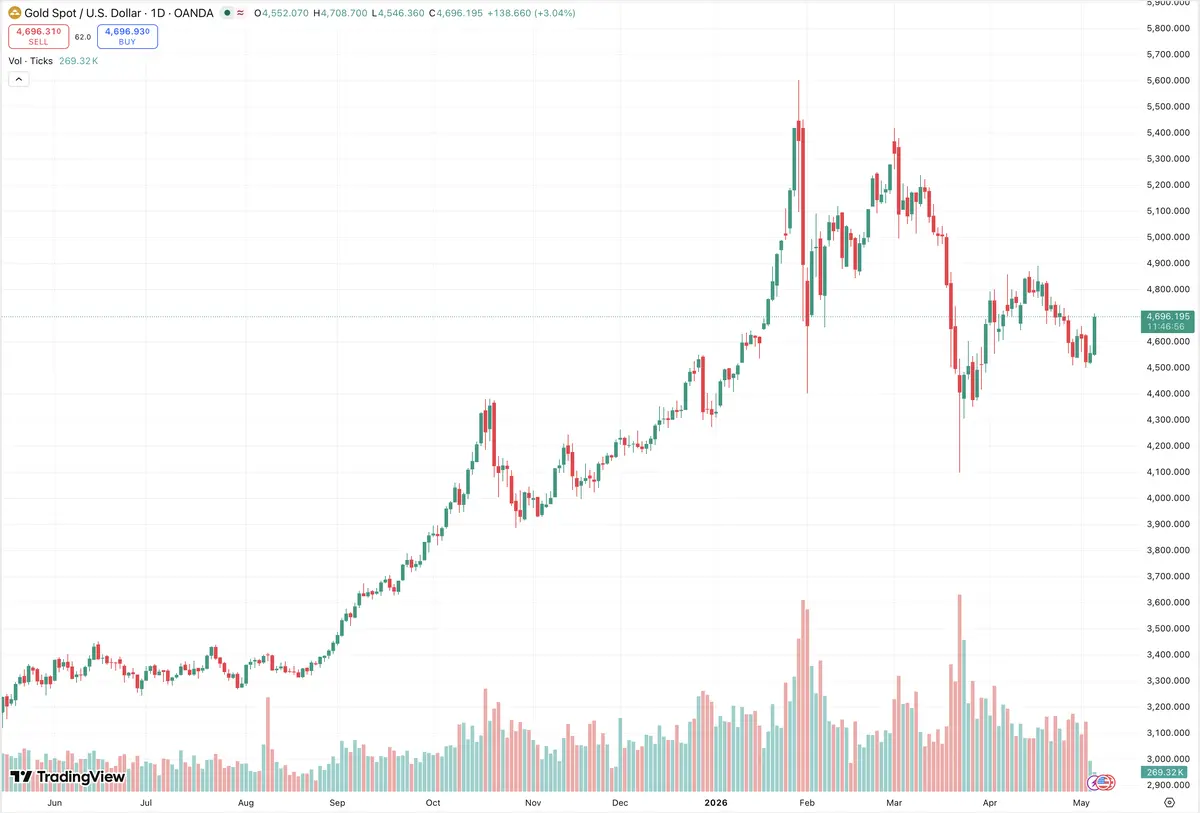
Gold trading against the US dollar on May 6, 2026, is characterized by a corrective recovery following a sharp monthly pullback. XAUUSD quotes have bounced from the psychological 4500 mark and, by mid − European session, are testing the 4500 mark and, by mid − European session, are testing the 4650–$4685 zone. The market is fueled by hopes of de-escalation surrounding Iran alongside a cooling US labor market. This creates a complex cocktail for the precious metal: it receives short-term support, but medium-term risks remain firmly in place. Traders should carefully select take-profit levels by relying on a clear synthesis of fundamentals and technicals.
Fundamental Snapshot – Three Pillars and One Hidden Brake
The first pillar is the geopolitical pause. Trump’s announcement to suspend “Project Freedom” operations and willingness for direct dialogue with Tehran sharply reduced the “fear premium” in the oil market. Brent futures fell below the $75 mark, and the dollar, counter to usual logic, is correcting downward as markets price in a lower probability of military escalation and a sharp inflation spike. For dollar-denominated gold, this is a short-term positive.
The second pillar is the softening of the American labor market. Yesterday’s JOLTS data (6.866 million job openings) missed the consensus forecast. Today’s ADP report (forecast 99k) may confirm a slowdown in hiring, and Friday’s Nonfarm Payrolls could come in weaker than expected. Any deterioration in employment statistics diminishes fears of Federal Reserve monetary tightening. Although CME Fed Watch still shows a 35 percent probability of a rate hike in December, clear labor market weakness could push this figure below 25 percent, supporting gold.
The third pillar is structural central bank demand. The People’s Bank of China has been increasing its reserves for the fifth consecutive week, buying physical metal on dips below 4600. Central banks of India and Kazakhstan are taking similar actions. This creates a dense “cushion” in the 4600.
The hidden brake is the real yield on US Treasury bonds. Even with a soft labor market, 10-year TIPS hold within the 2.15–2.25 percent zone. As long as the real rate remains above 2 percent, gold as a non-yielding asset lacks strong investment inflows. Major ETFs, according to Bloomberg data, have recorded outflows for the fourth consecutive session. It is precisely this contradiction that prevents the price from immediately soaring toward the historic highs near $5000.
Technical Architecture – The Key to Take-Profit
On the daily chart, the pair has formed a “morning star” candlestick pattern with its base in the 4501–4501–4512 zone. This is a reversal pattern, which upon confirmation could push quotes toward the 21-day Simple Moving Average at 4699. The price is currently pressing right against this level. A daily close above 4699.
Where to Place Take-Profit
For longs from the 4630–4630–4645 zone (retest of the 200-period SMA on H4), the first target is 4695, the second is 4695, the second is 4715. Extended targets for a confirmed breakout: 4753 and 4753 and 4862. Place the stop-loss below $4610 to give the price room to breathe while protecting against a breakdown of the reversal structure.
Summary in a nutshell: May 6 represents a bullish corrective day supported by geopolitical detente and dollar weakness. The range is 4610–4610–4725.

Comments
No comments yet. Be the first to share your thoughts!
Authentication Required
You must be logged in to post a comment.