

AUD/NZD – The Trans-Tasman Rivalry, Pure Yield Arbitrage, and Mean-Reversion Mechanics
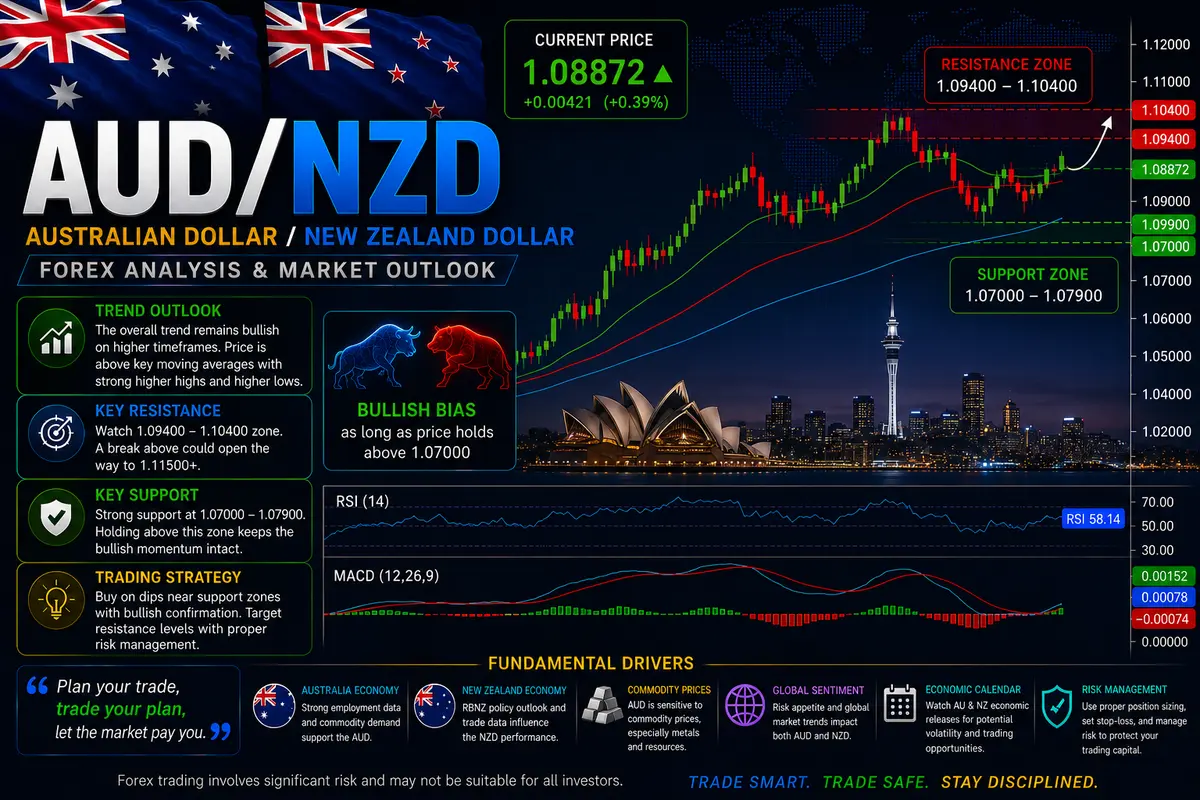
If you are exhausted by the wild, unpredictable 300-pip swings of GBP/NZD or the news-driven noise of USD pairs, AUD/NZD (the “Aussie-Kiwi”) is the exact antidote you need.
Sitting across the Tasman Sea from each other, Australia and New Zealand share deeply intertwined trade agreements, similar cultural demographics, and aligned business cycles. Because both underlying currencies react similarly to global macroeconomic shocks, AUD/NZD spends roughly 80% of its time locked in reliable, highly technical horizontal ranges.
For institutional desks, AUD/NZD isn’t a pair for chasing explosive momentum breakouts. It is a pure relative-strength vehicle used to exploit interest rate spreads and commodity price divergences between Sydney and Wellington.
The Fundamental Tension: Iron Ore vs. Whole Milk Powder
To understand what actually moves AUD/NZD when it does trend, you have to look past standard US Dollar news and focus entirely on the commodity exports driving both island nations.
1. Australia’s Industrial Metals Engine
Australia’s trade balance is powered by heavy industrial minerals—primarily iron ore, metallurgical coal, copper, and liquefied natural gas (LNG) shipped to Chinese steel mills and manufacturing centers.
-
When global industrial production ramps up and iron ore prices surge, Australian tax revenues swell and the RBA turns hawkish, pushing AUD/NZD higher.
2. New Zealand’s Agricultural Softs Engine
New Zealand, on the other hand, is an agricultural powerhouse whose currency moves on soft commodities—specifically whole milk powder, butter, and livestock.
-
When global dairy demand peaks during bi-weekly Global Dairy Trade (GDT) auctions, foreign capital flows straight into Wellington, driving AUD/NZD lower.
3. The Commodity Divergence Formula
When iron ore prices crash in China at the exact same time global dairy prices are skyrocketing, AUD/NZD experiences smooth, persistent downward trends. Conversely, if dairy prices slump while metal demand surges, AUD/NZD grinds steadily upward.
AUD/NZD=NZD/USDAUD/USD
Central Bank Policy: The RBA vs. RBNZ Interest Rate Spread
Because both nations are geographically close, foreign capital constantly rotates between Australian Commonwealth Bonds and New Zealand Government Bonds based on which central bank offers a higher yield.
-
Reserve Bank of Australia (RBA): The RBA tends to move cautiously, balancing rate decisions against Australia’s massive domestic mortgage debt.
-
Reserve Bank of New Zealand (RBNZ): The RBNZ has a history of acting more aggressively, often hiking or cutting rates in bold 50-basis-point moves to curb domestic inflation.
When the RBNZ aggressively hikes interest rates while the RBA sits on its hands, the widening yield differential attracts institutional yield-chasers into the Kiwi. This pulls AUD/NZD into multi-month downward channels.
When analyzing AUD/NZD, ignore the Federal Reserve. Your primary focus must be comparing the 2-Year Government Bond yield spread between Australia and New Zealand.
Session Liquidity and The Pacific Trading Window
Unlike European or American pairs that generate their primary volume during Western business hours, AUD/NZD lives and breathes during the Sydney and Wellington sessions.
AUD/NZD Intraday Schedule:
+---------------------------------------------------------------------+
| 17:00 - 19:00 EST | Wellington Open    | New Zealand Data & GDT News
| 19:00 - 01:00 EST | Sydney Open        | Primary Liquidity & RBA News
| 02:00 - 08:00 EST | London Session     | Low Volume / Tight Drift
| 08:00 - 17:00 EST | New York Session | Mean-Reversion / Range Bounds|
+---------------------------------------------------------------------+
1. The Pacific Prime Time (18:00 – 01:00 EST)
This is where 70% of the daily range on AUD/NZD is created.
-
Australian employment numbers, Australian CPI prints, RBA interest rate announcements, and Chinese economic data all hit the market between 19:30 and 21:30 EST.
-
New Zealand CPI, trade balance figures, and RBNZ policy statements drop right around 18:45 to 21:00 EST.
-
Trading Implication: If you want to trade AUD/NZD on lower timeframes (5-minute to 15-minute charts), you must be active during the Asian/Pacific session. By the time London and New York wake up, AUD/NZD usually settles into a quiet, 10-to-15 pip sideways drift.
Practical Execution Playbook for AUD/NZD
-
Trade the Mean-Reversion Bounds: Because AUD/NZD rarely stays in runaway trend mode, treat historical daily and weekly support/resistance levels as high-probability reversal zones rather than breakout triggers. Fading extreme moves at major higher-timeframe boundaries yields a high win rate.
-
Beware the Asian Breakout Fake: During the Sydney open (19:00 EST), algorithms frequently push price past the previous day’s high or low by 10 to 15 pips. If that breakout isn’t backed by an active RBA/RBNZ policy rate divergence, expect price to snap back violently into the established daily range.
-
Use Tighter Stops Than Other Crosses: Because AUD/NZD has a relatively modest Average Daily Range (ADR) of 50 to 70 pips, you don’t need the massive 50-pip stop losses required for GBP/NZD. A tight 15-to-25 pip stop loss gives you plenty of structural protection.
-
Target Internal Imbalances: When fading a range expansion, target internal 1-Hour Fair Value Gaps or the median (50% level) of the weekly range rather than holding out for unpromising 300-pip windfalls.

Comments
No comments yet. Be the first to share your thoughts!
Authentication Required
You must be logged in to post a comment.