

Hey u don’t need to trouble ur mind trying to figure out how to read or analyse complicated candlestick chart, in this article, I have break it down for u in a simplified English language.
How to Read Candlestick Charts Like a Pro
Candlestick charts are one of the most powerful tools in forex trading. They provide traders with valuable information about price movements, market sentiment, and potential trading opportunities. Unlike line charts, candlestick charts reveal the battle between buyers and sellers during a specific period, making them an essential part of technical analysis. Learning how to read candlestick charts correctly can help traders make better decisions and improve their overall trading performance.
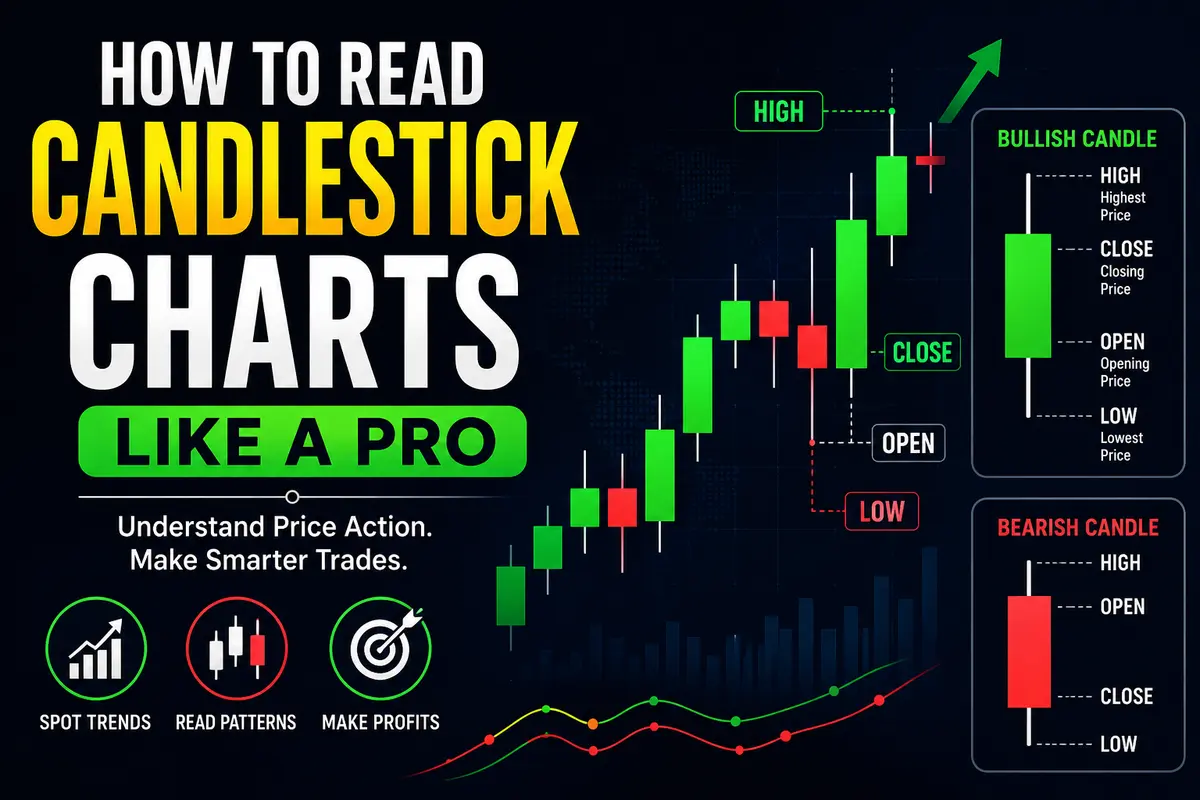
A candlestick represents the price movement of a currency pair over a selected timeframe. This timeframe can be one minute, five minutes, one hour, four hours, one day, or even one month. Each candlestick tells a story about what happened during that period by showing four important prices: the opening price, the highest price, the lowest price, and the closing price.
Every candlestick consists of two main parts: the body and the wicks, also known as shadows. The body shows the difference between the opening and closing prices. The wicks represent the highest and lowest prices reached during the trading period. By examining both the body and the wicks, traders can understand who was in control of the market.
Bullish candlesticks indicate that buyers dominated the market during the selected period. These candles are commonly displayed in green or white, depending on the trading platform. A bullish candle forms when the closing price is higher than the opening price, showing that buyers pushed prices upward.
Bearish candlesticks show that sellers controlled the market. They are usually displayed in red or black. A bearish candle forms when the closing price is lower than the opening price, indicating that sellers successfully drove prices lower during that trading session.
The size of a candlestick’s body is also important. A long bullish body suggests strong buying pressure and confidence among buyers. A long bearish body indicates strong selling pressure. On the other hand, a small body often signals indecision, where neither buyers nor sellers have complete control of the market.
The length of the wicks provides additional clues about market behavior. A long upper wick means buyers pushed prices higher, but sellers forced the price back down before the candle closed. This may indicate that buyers are losing strength. A long lower wick shows that sellers pushed prices lower, but buyers regained control and moved the price back up before the candle closed. This often suggests buying interest.
One of the most recognized candlestick patterns is the Doji. A Doji forms when the opening and closing prices are almost equal, creating a very small body. This pattern reflects market indecision because neither buyers nor sellers managed to take control. A Doji often appears before a trend reversal or during periods of uncertainty.
Another popular pattern is the Hammer. The Hammer has a small body near the top of the candle and a long lower wick. It usually appears after a downtrend and may signal that buyers are beginning to gain strength. Although sellers pushed prices lower, buyers managed to recover most of the losses before the candle closed.
The Shooting Star is the opposite of the Hammer. It has a small body near the bottom and a long upper wick. This pattern often appears after an uptrend and may indicate that sellers are preparing to take control. Buyers initially pushed prices higher, but sellers forced the market back down before the close.
The Bullish Engulfing pattern is another powerful signal. It occurs when a large bullish candle completely covers the previous bearish candle. This pattern suggests that buyers have taken control and that the market may move higher. Traders often look for this pattern near support levels for stronger confirmation.
The Bearish Engulfing pattern works in the opposite direction. It appears when a large bearish candle completely covers the previous bullish candle. This may indicate that sellers have gained control and that prices could begin falling, especially near resistance levels.
While candlestick patterns are valuable, professional traders never rely on a single candle alone. They always consider the overall market trend. For example, bullish patterns are generally more reliable during an uptrend, while bearish patterns tend to perform better during a downtrend. Trading with the trend often increases the probability of success.
Support and resistance levels also play a major role in candlestick analysis. A bullish reversal pattern that forms near a strong support level has a higher chance of leading to a price increase. Likewise, a bearish reversal pattern near resistance may indicate that prices are about to decline.
Trading volume can also strengthen candlestick signals. High trading volume during a breakout or reversal often confirms that the move is supported by many market participants. Low volume may suggest a weaker signal that requires additional confirmation.
Beginners should avoid making trading decisions based on emotions. Instead, they should combine candlestick analysis with proper risk management, including stop-loss orders and realistic profit targets. Even the strongest candlestick pattern cannot guarantee a successful trade because financial markets are always unpredictable.
Practice is the key to mastering candlestick charts. Traders should spend time analyzing historical charts, identifying patterns, and observing how prices react afterward. Demo accounts provide an excellent opportunity to develop these skills without risking real money.
It is also important to remember that no candlestick pattern works perfectly every time. Professional traders accept that losses are part of trading and focus on following a consistent strategy rather than trying to win every trade. Discipline, patience, and continuous learning are what separate successful traders from beginners.
In conclusion, candlestick charts are an essential tool for understanding price action in the forex market. By learning how to interpret candle bodies, wicks, and common candlestick patterns, traders can gain valuable insights into market sentiment and potential trading opportunities. However, candlestick analysis should always be combined with trend analysis, support and resistance levels, and sound risk management. With regular practice and disciplined execution, traders can learn to read candlestick charts like professionals and make more confident trading decisions.

Comments
No comments yet. Be the first to share your thoughts!
Authentication Required
You must be logged in to post a comment.