
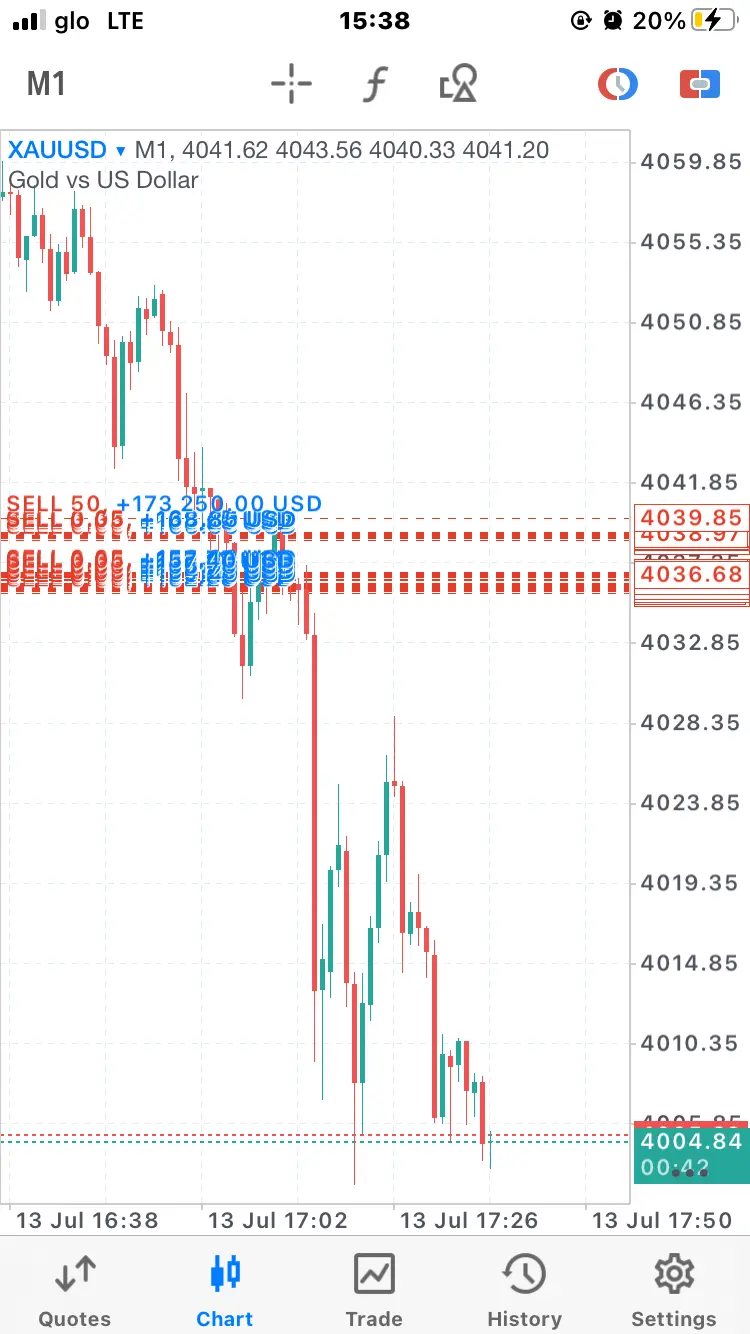
Mastering Market Structure: The Universal Map Every Trader Needs

Mastering Market Structure: The Universal Map Every Trader Needs
Every market leaves footprints. It doesn’t matter if you’re looking at a 5-minute crypto chart, tracking Apple stock on the daily, or scanning EURUSD ... during the London open. Price leaves clues everywhere.
The problem? Most traders waste years chasing lagging indicators. They tweak RSI settings, test double moving average crossovers, or wait for Stochastic lines to magically solve the market. It doesn’t work. Indicators only summarize what already happened. If you want to know where price is actually heading, you have to read the core engine of price itself: market structure.
Understanding the Core Blueprint
Strip away the indicators, and the market becomes surprisingly simple. Price moves in natural cycles of expansion, contraction, and consolidation. It’s just an endless tug-of-war between buyers and sellers fighting over liquidity.
Across every asset class and timeframe, you’ll see the market rotate through three main states:
-
Uptrends: Price makes higher highs and higher lows. Buyers clearly hold the steering wheel, and dips get bought quickly.
-
Downtrends: Price makes lower highs and lower lows. Sellers dominate the room, breaking support levels while buyers fail to defend pullbacks.
-
Ranges: Price bounces back and forth between obvious floor and ceiling levels. Neither side has control, creating a messy chop where orders pile up on both sides.
If you can identify which state the market is in right now, you instantly avoid the biggest mistake in trading: trying to buy a crashing market or shorting a moonshot.
Identifying the Shift: BOS vs. CHOCH
Once you spot the overall trend, you need to know when it’s healthy and when it’s about to fall apart. This comes down to two key price events.
First, there’s the Break of Structure (BOS). When a market is trending up and punches cleanly past its last swing high, that’s a BOS. It confirms the trend has real momentum behind it and wants to stretch higher.
Then comes the warning sign: the Change of Character (CHOCH).
Picture a stock climbing steadily for weeks, making clean higher highs and higher lows. Suddenly, aggressive selling steps in, and price drops hard enough to slice right through the previous higher low. That sudden breakdown is your CHOCH. It’s the market telling you, “The buyers just lost control.”
For beginners, spotting a CHOCH keeps you from buying a trap. For experienced traders, it gives you an early ticket into a brand-new trend long before any technical indicator flashes a signal.

Why This Works Across All Markets
A common myth in trading is that stocks, forex, and crypto require totally different analytical rules. Sure, volatility and market hours change, but human psychology never does. Fear, greed, and institutional execution look identical on a chart.
-
Forex: Big banks move trillions of dollars based on interest rates and central bank policies. Yet, currency pairs consistently respect higher-timeframe market structure levels day in and day out.
-
Stocks & Indices: Earnings reports and macroeconomic news drive stock momentum. But when you look at the USCL.TO ... or individual tech stocks, price still respects structural pullback zones before making new highs.
-
Crypto: Bitcoin and altcoins are famous for violent swings. Even so, crypto respects structural highs and lows, often sweeping old levels to collect orders before launching into multi-month trends.
-
Options: Options decay over time, so directional accuracy is everything. Reading market structure lets options traders time breakouts precisely, avoiding theta decay while catching quick volatility spikes.
Practical Rules for Execution
If you want to trade structure like a professional, keep these rules pinned near your workstation:
-
Start High, Execute Low: Always establish your macro trend on the 4-Hour or Daily chart first. Only zoom in to the 5-Minute chart when you’re actually ready to trigger an entry.
-
Never Buy an Extended Move: Wait patiently for price to pull back toward a strong higher low or fresh demand zone. Buying at the peak of an expansion is a recipe for getting stopped out.
-
Focus on Candle Closes: Wicks show where price was rejected, but full candle body closes confirm real structural breaks. Never assume a structure has broken until the candle actually closes.
When you remove the clutter and focus on pure price structure, trading stops feeling like guesswork. You start seeing the market for what it actually is—and you can finally trade alongside institutional flow.


Comments
No comments yet. Be the first to share your thoughts!
Authentication Required
You must be logged in to post a comment.