XAUUSD Forecast for May 5, 2026
Gold (XAUUSD) trading this week will be shaped by a complex interplay of geopolitical risks, the Fed’s hawkish monetary policy, and key technical levels. Below is a concise overview of the key factors, the expected price range, and practical take-profit recommendations.
Fundamental Background: Oil Shock and a Hawkish Fed
The main fundamental driver for gold in May 2026 is the fallout from the geopolitical crisis in the Middle East. The blockade of the Strait of Hormuz and the rise of Brent crude to $118 per barrel have triggered a supply shock and a sharp acceleration in global inflation. Instead of enhancing gold’s appeal as a safe-haven asset, this shock has backfired: inflation is forcing the Fed and other central banks to keep rates higher for longer, increasing the opportunity cost of holding non-yielding bullion. Expectations for a rate cut in 2026 have all but disappeared, and the futures market is already pricing in a 24% probability of a rate hike by April 2027. The upcoming inauguration of new Fed Chair Kevin Warsh (May 15) only reinforces the market’s hawkish sentiment.
Adding to the downward pressure on prices is the fragile, yet still present, hope for a diplomatic détente between the US and Iran. A 14-point peace plan submitted by Tehran through Pakistani mediation, along with an extension of the ceasefire regime, is temporarily reducing the “chaos premium” built into gold prices. Meanwhile, fundamental support from central banks remains: they bought 244 tonnes in Q1 2026, and total demand rose 2% to 1,231 tonnes. The World Bank forecasts an average gold price of around $4,700 in 2026 but acknowledges that growth drivers are facing growing macroeconomic headwinds.
Technical Picture: Bearish Trend and Battle for Key Levels
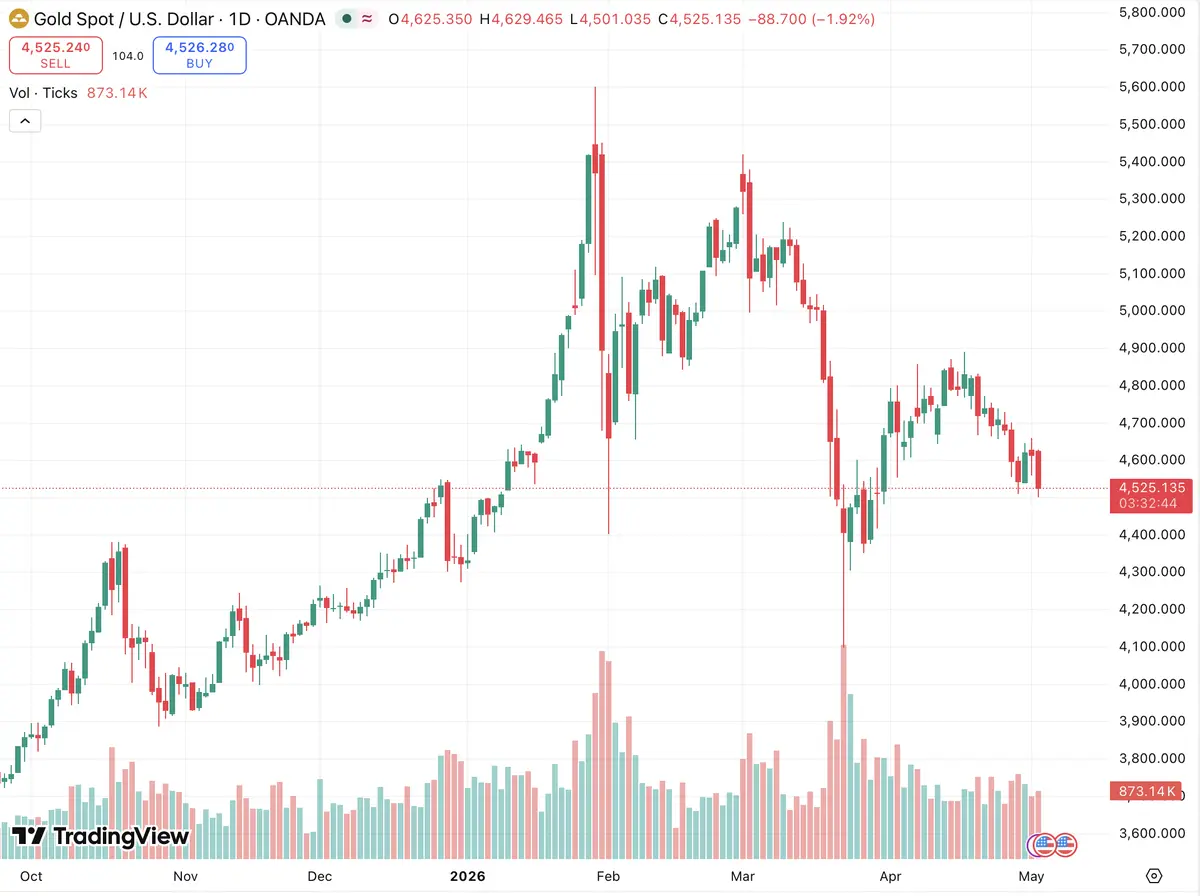
The technical configuration of XAUUSD as of May 4 is distinctly bearish. On the daily chart, the price is holding below the 100-day SMA (around 4,761) and the 61.8% Fibonacci level (4,603), keeping the near-term trend under sellers’ control. The RSI(14) stands at 39 and is pointing lower, the MACD is descending into negative territory, and ADX indicates a weakening trend but not a reversal. On the 4-hour timeframe, the price is consistently making lower lows, respecting a descending trendline, and only a close above the 4,660 level could shift the short-term balance of power.
Price Range for May 5 and the Trading Week
The consensus forecast from several analytical sources points to continued consolidation with a bearish bias. Institutional flows show a significant buyer interest zone around 4,500–4,550, attributed to position accumulation by central banks and sovereign wealth funds. However, the “Death Cross” (downward crossing of the 5- and 9-day EMA) on the daily timeframe signals that the market has shifted from buying dips to selling rallies. Expected range for May 5: 4,500–4,500–4,650 per ounce. The base scenario is a test of support at 4,535–4,500, with the risk of accelerating the decline toward the 4,450 level if strong US jobs data is released on Friday. The alternative scenario would materialize on unexpectedly weak macro data or a sharp escalation in geopolitics — in that case, a bounce to the upper bound of the 4,650–4,700 range is likely.
Conclusion
TOn May 5, 2026, the gold market will continue to navigate the tension between oil-driven inflation and a persistently hawkish Federal Reserve. The short-term trend remains bearish, and as long as the daily close stays below $4,660, selling into rallies remains the preferred strategy.
Traders should closely monitor the macroeconomic calendar: the ISM Services PMI (May 5) and the Nonfarm Payrolls report (May 8) have the potential to trigger sharp price movements and could extend the ranges outlined above.

Comments
No comments yet. Be the first to share your thoughts!
Authentication Required
You must be logged in to post a comment.