

Gold (XAU/USD) July 8, 2026: Assault on $4100. Buy the breakout or wait for a pullback?
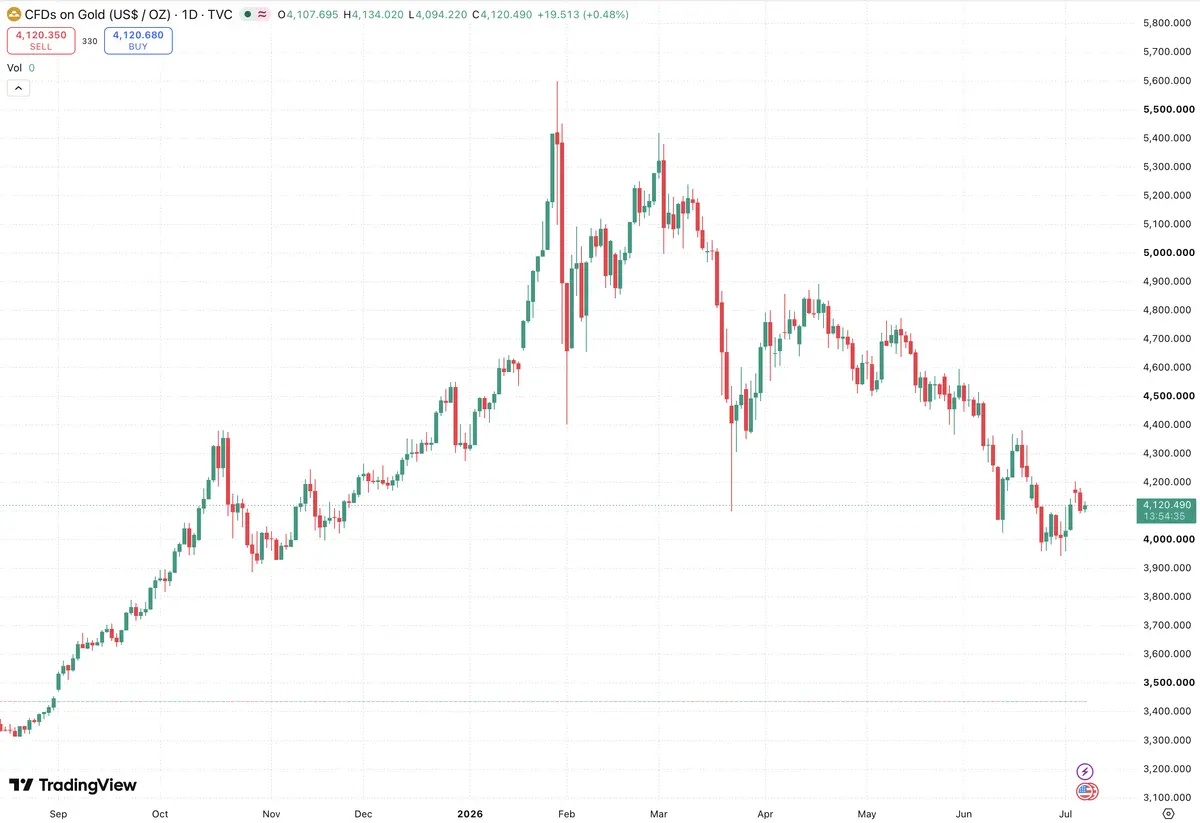
During the morning session on July 8, gold is consolidating just below the significant resistance level of $4130, following yesterday’s false breakout above the $4100 mark. The market is in a decision-making phase ahead of the FOMC minutes release and tomorrow’s CPI inflation data. The current technical picture, combined with the fundamentals, suggests that being long remains the priority. However, with oscillators looking overbought on the daily chart, a strict entry point selection is necessary.
Fundamental backdrop: why $4100 is not the ceiling
The key driver that propelled gold to the $4100 mark is a radical shift in Fed policy. During 2025–2026, the regulator implemented a rate-cutting cycle (current range 3.50–3.75%), and the market is pricing in another easing in September. 10-year Treasury yields have dropped below 3.2%, and real rates have moved deep into negative territory, stripping the dollar of its appeal.
The US Dollar Index (DXY) has broken multi-year support and is trading at 94.50. In parallel, we are witnessing historic demand for physical metal: the BRICS nations are actively replenishing reserves in an effort to reduce dependence on the dollar in international settlements. The escalation of the conflict in the South China Sea is adding a risk premium to the market. Against this backdrop, any attempts at a gold correction are being aggressively bought.
The only risk for buyers today is technical overbought conditions and potential profit-taking ahead of the CPI release.
Technical breakdown: a bullish flag near the highs
On the daily timeframe, XAU/USD has formed a “bullish flag” pattern since early June: a sharp rally from $3880 to $4130 was followed by a sloping consolidation with declining highs and solid support at $4060. Yesterday’s candle closed with a long lower shadow off the $4072 level, signaling strong buying power.
The 4-hour chart confirms the accumulation: the price is sandwiched between the 50 EMA ($4085) and resistance at $4130. Volumes on pullbacks are minimal. The daily RSI oscillator stands at 68 — not yet in the overbought zone, but close to it. The classic scenario suggests a breakout above the flag’s upper boundary.
Key levels for July 8:
-
Support: $4080 (50 EMA on H4), $4060 (lower boundary of the flag and yesterday’s bounce zone), $4030 (safety net level).
-
Resistance: $4130 (local high and flag boundary), $4150 (psychological level), $4200 (flag height projection).
Trading plan: buy with confidence, short with caution
Primary scenario — BUY:
As long as gold holds its structure above $4060, we remain in a bullish trend. The most rational tactics for today are:
Aggressive entry from support:
-
Entry point: $4085–4075 zone (a test of the intraday EMA amid morning volatility).
-
Stop-loss: $4045 (below yesterday’s low and the $4060 level with a buffer).
-
Take-profit (where to lock in profits):
-
TP1: $4130 (retest of the highs, closing 40% of the position).
-
TP2: $4180 (psychological level and extension zone, closing 40%).
-
TP3: $4220 (Fibonacci extension target, remaining 20% with a trailing stop).
-
Conclusion: betting on the rally’s continuation
Today, July 8, 2026, the balance of power tilts entirely in favor of the bulls. The market is largely shrugging off short-term risks (CPI) and pricing in further dollar weakness. Buying from the established support at $4085–4075, with targets at $4130 and above $4180, appears to be the most rational plan. Be sure to use stop orders, as volatility can widen spreads dramatically in anticipation of news events.

Comments
No comments yet. Be the first to share your thoughts!
Authentication Required
You must be logged in to post a comment.