

Natural Gas Futures Rose During the European Session

Introduction: Friday’s Gas Rebound
Friday, European trading session. Traders in London, Frankfurt, and Amsterdam open their terminals and see that natural gas is once again in the spotlight. NYMEX futures for August delivery rise to $3.24 per million British thermal units, gaining 1.35% compared with the previous close. This is not a dramatic surge, not a rally rewriting history, but it is a confident move that brings gas back into investors’ focus.
0.35% is not the most impressive figure, but in the context of recent weeks, when gas has been moving between support and resistance, any gain is perceived as a positive signal. Especially against the backdrop of WTI crude oil, which on Friday remained practically unchanged — 0.00% growth at $68.69 per barrel. Gas decided to break ahead, showing that it has its own drivers independent of the oil market.
The technical picture also gives reason for discussion. Support is located at $3.151, while resistance stands at $3.328. The current price of $3.24 is slightly above the middle of this range, which suggests that traders have room to maneuver. If gas manages to break through resistance at $3.328, this will open the way toward $3.50 and higher. If it pulls back toward support, this will signal that the upward momentum has faded.
The dollar index, which often affects commodity prices, fell by 0.04% to 100.58 points. This is a minor decline, but even it works in favor of gas, making it slightly cheaper for holders of other currencies. However, the dollar remains strong, and its influence on gas is still limited.
So what is behind this growth? Summer cooling demand, lower production, geopolitical instability, or simply a technical rebound after oversold conditions? Let’s examine what is really driving natural gas this Friday and what to expect from it in the coming weeks.
Fundamental Factors: What Is Driving Gas on Friday
Hot Summer — High Demand
One of the key factors behind the rise in natural gas prices is seasonality. Summer in the Northern Hemisphere, especially in the United States and Europe, means increased demand for electricity used for air conditioning. Gas remains one of the main sources of power generation, especially in the U.S., where it is replacing coal.
Weather forecasts for the coming weeks point to higher-than-normal temperatures in the southern and central U.S. states. This means that demand for gas for cooling will remain high, supporting prices.
The situation in Europe is similar. Hot weather in Southern Europe is increasing electricity consumption, and gas-fired power plants are operating at full capacity. Although European storage facilities are filled above average levels, current demand is creating additional need for supplies.
This summer increase in demand is a classic factor that traders take into account when pricing. But summer demand alone is not enough for sustainable growth. Supply-side factors are also needed.
Lower Production in the U.S.
There are also positive signals on the supply side. Natural gas production in the U.S. has begun to decline after prices fell below $3 per MMBtu in previous months. Producers, especially in shale basins, are reducing drilling because production becomes unprofitable at low prices.
According to Baker Hughes, the number of active gas drilling rigs has been declining for several weeks in a row. This suggests that supply may shrink in the coming months, creating a basis for price growth.
In addition, some producers have announced cuts to capital expenditures for 2026, which also points to lower production in the medium term. The market is beginning to price this in, and today’s rise reflects expectations that supply will become more balanced.
Export Potential
Exports of liquefied natural gas (LNG) from the U.S. remain high, especially to Europe and Asia. Although European storage facilities are filled above average levels, demand in Asia, particularly in China and India, continues to grow.
China, the largest importer of LNG, is increasing purchases amid economic recovery and hot weather. India is also increasing imports, replacing coal with cleaner gas.
This creates additional demand for U.S. LNG, which competes with supplies from Qatar and Australia. Rising export demand supports U.S. gas prices because producers prefer selling gas to foreign markets where prices are higher.
Technical Analysis: Where the Levels Are and What They Indicate
Support at $3.151: A Base for Growth
The support level at $3.151 has been tested several times in recent weeks, and each time gas has rebounded upward from it. This indicates that the level has psychological significance. Buyers see that the price cannot break through this mark and use it as an entry point.
Support at $3.151 also coincides with the 50-day moving average, which adds technical importance to it. As long as the price stays above this level, the technical picture remains bullish.
If gas falls below $3.151, this could trigger a new wave of selling, as traders would perceive the breakdown as a signal of further decline. But as long as support holds, there are grounds to expect upward movement.
Resistance at $3.328: The First Barrier
Resistance at $3.328 is the level that gas has tried to break several times but without success. This level coincides with recent weekly highs and serves as a psychological barrier.
If gas manages to consolidate above $3.328, this will become a signal for many technical traders, who will begin opening long positions. In that case, the next target will be $3.50, followed by $3.75.
But while resistance remains unbroken, the market is in equilibrium. Traders will closely watch how the price behaves near this level. If momentum weakens, gas may pull back toward support.
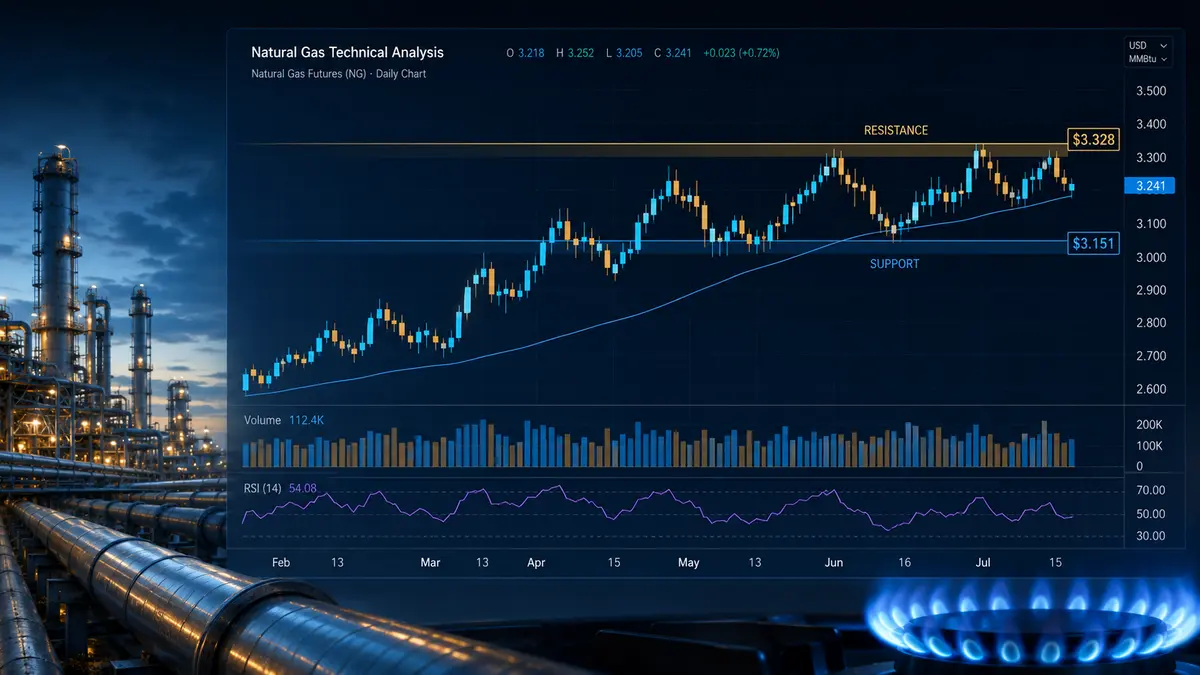
Volumes and Indicators
Trading volumes on Friday were slightly above average, suggesting that the rise has support. Open interest in futures also began to grow, indicating the entry of new long positions.
Indicators such as the RSI, or Relative Strength Index, are at neutral levels, showing neither overbought nor oversold conditions. This leaves room for movement in either direction, although the technically bullish tone still prevails.
Comparison with Oil: Gas vs. WTI
Why Gas Is Rising While Oil Is Standing Still
Interestingly, on Friday, when gas gained 1.35%, WTI oil remained unchanged — 0.00% growth at $68.69 per barrel. This divergence deserves attention.
The reason lies in different fundamental factors. Oil is currently under pressure due to oversupply, the return of Iranian oil, and weak demand forecasts. Gas, meanwhile, is benefiting from the summer season, lower U.S. production, and export growth.
In addition, the gas market is more regional than the oil market. While oil trades on global markets, gas depends heavily on regional factors — weather, storage levels, and drilling dynamics. That is why gas can move independently of oil, which is exactly what we are seeing today.
This divergence also indicates that investors are looking for more specific bets in the commodities sector. Instead of buying oil, which is under pressure, they are buying gas, which has its own growth drivers.
Spreads and Correlations
In the long term, gas and oil are correlated, but short-term divergences can occur. Right now, we are seeing exactly such a period, with gas outperforming oil.
This may be a sign that investors expect an improvement in the gas market in the coming weeks. If so, the gap between gas and oil may persist or even widen.
On the other hand, if gas continues to rise while oil remains flat, this could create arbitrage opportunities. Some traders may begin buying gas and selling oil in anticipation of correlation normalization. For now, however, this strategy remains one for professionals.
What Awaits Gas in the Coming Weeks
Summer Demand Peak
In the coming weeks, gas is likely to continue receiving support from summer demand. Weather forecasts point to high temperatures in the U.S. and Europe, which will stimulate electricity consumption and, consequently, gas demand.
This is especially important for the United States, where air conditioning is the main driver of summer demand. The hotter the weather, the more gas is burned at power plants.
In Europe, although storage facilities are filled above average levels, current demand will also support prices. This is especially true in Southern Europe, where the heat is particularly intense.
Inventories and Balance
U.S. gas inventory data is released every Thursday, and it will be an important indicator for the market. If inventories continue to decline faster than usual, this will become a bullish signal.
Currently, inventories are close to the five-year average, but given lower production and high demand, they may begin to shrink. This could potentially push prices higher.
Risks and Uncertainty
Risks should not be forgotten. The U.S. hurricane season may disrupt gas production and transportation, which could cause sharp price spikes. Conversely, if the weather turns milder than expected, demand may decline and prices may fall.
Geopolitical risks also remain. The situation in the Middle East, negotiations over Iran, and possible disruptions to LNG supplies could all affect the gas market.
There is also the risk that the current rise is merely a technical rebound after the previous decline. If supply remains high and demand does not grow fast enough, prices could fall below $3 again.
Conclusion: $3.24 Is Not a Coincidence, but a Signal
Natural gas futures rose by 1.35% during the European session on Friday, reaching $3.24 per MMBtu. This was not a random move, but the result of a combination of factors: summer demand, lower production, export growth, and the technical picture.
Support at $3.151 and resistance at $3.328 define the trading range. As long as the price remains within this range, the market is in equilibrium. But if gas manages to break through resistance, this could mark the beginning of a new upward trend.
Unlike oil, which remained flat, gas is showing that it has its own drivers. Summer heat and lower U.S. production are creating a foundation for growth, and investors are beginning to notice this.
Of course, risks remain. Weather may change, inventories may turn out higher than expected, and the geopolitical situation may worsen. But at the moment, momentum is pointing upward, and gas is taking advantage of it.
For traders, this means opportunities. Those who believe in continued growth may open long positions with a target of $3.50. Those who are doubtful may wait for a breakout above $3.328 or a pullback toward $3.151.
But one thing can be said with certainty: natural gas is back in the spotlight. And this Friday move is not just a ripple on the chart, but a signal that the market is beginning to reassess its attitude toward this key energy commodity. That means we are in for an interesting summer.

Comments
No comments yet. Be the first to share your thoughts!
Authentication Required
You must be logged in to post a comment.