US SESSION · WEDNESDAY 17 JUNE 2026 · FOMC DAY Oil at a 3-Month Low. The S&P 500 a Whisker From Its Record. And at 2:00 PM ET, Everything Changes
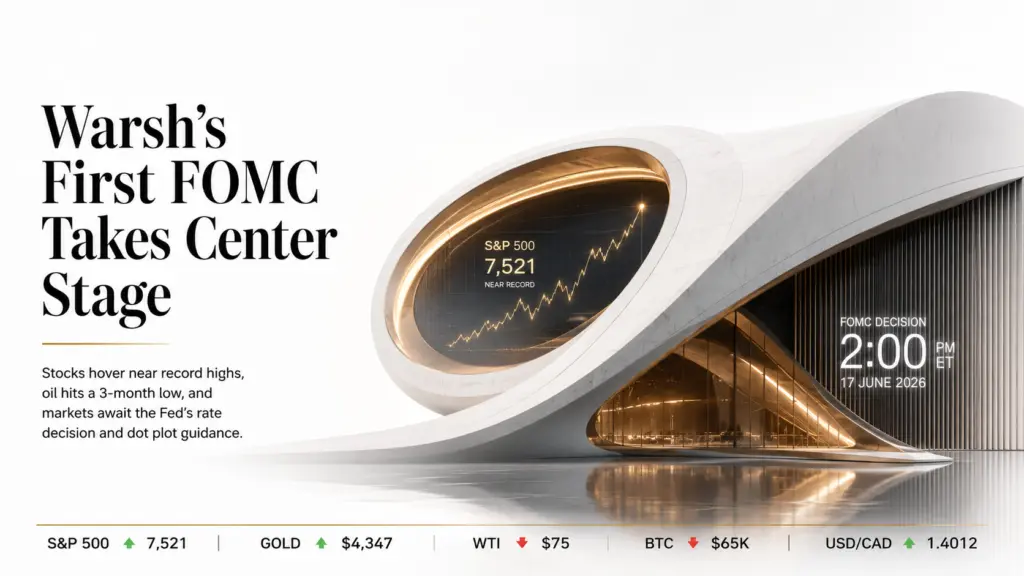
Wall Street is sitting on its hands this morning. WTI at $75.40 — a 15-week low. The S&P 500 near 7,521, a whisker below its all-time record. The 20-year yield pinned at 5.05%. May retail sales came in at +0.9% — nearly double the forecast. And at 2:00 PM ET, Kevin Warsh tells you whether any of this matters or whether the fight against inflation is still on.
The session before a Fed decision is always the same in structure and always different in content. The structure is a holding pattern — low volume, narrow ranges, every participant waiting for the same thing. The content today is unusually rich. Oil is at a 15-week low on Iranian barrel flows beginning to return through a reopening Strait of Hormuz, doing exactly the disinflationary work the Fed has been unable to do through rate policy alone. May retail sales came in at +0.9% against a +0.5% forecast — the strongest reading since January, proof that the US consumer has not cracked under 4.2% inflation. The S&P 500 is sitting near 7,521, a whisker below its all-time record. And the 20-year Treasury yield is pinned at 5.05%, which is the bond market saying: I am not convinced Warsh is dovish yet.
The rate decision at 2:00 PM is settled — a hold at 3.50 to 3.75% is priced at 97% probability. What is not settled is everything around it: the dot plot, which is expected to erase the last pencilled-in 2026 cut and may show some participants beginning to price hikes; and the press conference tone at 2:30 PM, where Warsh will either acknowledge that the Iran deal’s disinflationary impulse changes the calculus — which is dovish — or foreground the still-elevated core services CPI and the surprise retail beat — which is hawkish. Every position in this session is a bet on which version of that press conference materialises.
The rate is settled. The dot plot and the 18 minutes after 2:30 PM are what everyone is actually waiting for.
The S&P 500 at 7,521: The Math of a Stretched Market
The S&P 500 near 7,521 is 1.2% below its early-June record around 7,610. That sounds comfortable. It is not, from a risk-reward perspective, because the index has already priced a substantial amount of good news — the Iran peace deal’s disinflationary effect, a consumer that keeps spending despite 4.2% inflation, and a Fed that is expected to be at least neutral tonight. The question is not whether the market can go higher. It is what the risk-reward looks like when the upside case (dovish Warsh, record broken this week) is already partially priced and the downside case (hawkish Warsh, dot plot removes cuts and hints at hikes) could send the index toward 7,200 to 7,300 in an afternoon.
The retail sales beat at +0.9% is the complicating factor. It is the strongest consumption reading in months, which is good for earnings — but it is also exactly the kind of data that gives a hawkish Fed Chair the justification he needs to maintain a restrictive stance. A consumer that keeps spending under 4.2% inflation is a consumer that is not being meaningfully constrained by current rates. That is Warsh’s hawkish data point. The Iran deal’s oil deflation is his dovish data point. Which one he chooses to lead with in the press conference determines the market’s direction for the rest of the week.
WTI at $75.40: The Fed’s Unexpected Ally
WTI crude at $75.40 is the most consequential number in today’s session that nobody is explicitly talking about — because it is doing the Fed’s work for it. When oil falls from $95 to $75, headline CPI drops roughly 0.4 to 0.5 percentage points over the following two to three months as the energy component deflates. That means the 4.2% May CPI that has been forcing the Fed’s hand starts heading toward 3.7 to 3.8% by August — without the Fed doing anything. The Iran peace deal, which includes the formal reopening of the Strait of Hormuz on 19 June, is delivering disinflation at a pace that rate hikes cannot match in the near term.
This is the central tension of today’s FOMC. Warsh walks into the room with May CPI at 4.2% and May retail sales at +0.9% — both hawkish data points. He also walks in knowing that WTI is at $75.40 and heading lower, and that the headline CPI that justified the market’s hawkish repricing over the past month is about to deflate mechanically. A sophisticated Fed Chair acknowledges both sides. A credibility-establishing new Chair who wants to be taken seriously as an inflation fighter foregrounds the data he has, not the data he expects. That is the analytical tension that makes today’s press conference genuinely uncertain.
Gold at $4,347: Five Sessions Up and Still Going
Gold’s five-session winning streak to $4,347 is one of the session’s more analytically interesting developments, because it is rising into a Fed meeting at which many people expect a hawkish tone — the exact environment that traditionally pressures non-yielding gold. The explanation is real rates. When oil falls from $95 to $75, inflation expectations fall even as nominal yields stay elevated, and falling inflation expectations with stable nominal yields means rising real yields — which should pressure gold. But the market is reading it differently: falling oil is being interpreted as reducing the likelihood of further Fed hikes, which keeps nominal yields from rising further, which keeps real yields from rising further, which removes the forward-looking headwind for gold.
The World Gold Council’s Q1 2026 demand figure of 1,231 tonnes — the highest January-March figure ever recorded — is the structural floor. Central banks are accumulating regardless of the rate cycle. The geopolitical diversification away from dollar-denominated reserves, accelerated by three months of Iran conflict, does not reverse because the peace deal was signed. Gold’s resistance sits at $4,380 to $4,400. A dovish Warsh pushes through it. A hawkish hold creates a pullback toward the $4,180 to $4,220 zone — which at that point becomes an accumulation opportunity rather than a structural break.
Alphabet at $371: The AI Trade That Doesn’t Need the Fed to Work
Alphabet at $371 is 7.7% below its $402 record high set earlier this year. The HSBC-Google Cloud partnership announced this week — a multi-year deal for AI infrastructure and enterprise services — is the kind of recurring revenue catalyst that makes Alphabet less dependent on advertising cycle fluctuations and more anchored to the secular AI infrastructure buildout. The TPU v5 architecture update and Gemini model improvements are the product-cycle equivalents of Intel’s 18A process node: a company executing technically while the market debates macro.
Alphabet’s FOMC sensitivity is real but asymmetric. It is a high-multiple long-duration equity — a hawkish Warsh that pushes long yields higher compresses its valuation multiple. But the business does not need a dovish Fed to keep growing: cloud and AI demand is structural and accelerating regardless of the rate cycle. The $355 to $360 zone is where the risk-reward genuinely shifts in favour of accumulation, with a stop at $340 below the broader consolidation range. At $371, it is not yet at that entry level — which means today’s FOMC is the event that either creates the entry (hawkish) or confirms the bull case without providing a clean dip (dovish).
Bitcoin at $65,140 and Solana at $72.44: The FOMC Binary in Crypto
Bitcoin at $65,140 has risen roughly 6% on the week on geopolitical relief from the Iran deal. Solana at $72.44 is sitting deeply oversold — the RSI on the weekly chart is the most extreme reading since the 2022 bear market — with a genuine institutional adoption story underneath: Solana spot ETF assets have been growing, the Alpenglow protocol upgrade (targeting 100 to 150 millisecond finality) has 98% validator endorsement, and the tokenised SPCX SpaceX shares launched on Solana this week. These are real adoption catalysts.
Both assets face the same FOMC binary. Dovish Warsh: BTC tests $70,000, Solana recovers toward $80 to $85. Hawkish Warsh: BTC tests $63,000, Solana pulls back toward $65 to $67. The interesting observation is that Solana’s adoption story means it has a theoretical floor that pure-sentiment assets lack — institutional ETF buyers and the Alpenglow upgrade are reasons to accumulate at lower prices even in a hawkish environment. BTC’s floor is purely institutional, driven by ETF demand. Both are real, but Solana’s is newer and therefore less tested.
USD/CAD at 1.4012 and USD/CHF at 0.7930: The Dollar’s Sideways Day
USD/CAD at 1.4012 is the Iran deal’s FX expression in its clearest form. Canada exports oil. When WTI falls from $95 to $75, the Canadian dollar’s terms of trade deteriorate in real time. USD/CAD above 1.40 is the market pricing in a structurally weaker CAD as oil finds a new equilibrium at peace-deal prices rather than conflict prices. The FOMC is a secondary driver: a hawkish hold pushes USD/CAD toward 1.41 to 1.42; a dovish surprise allows a modest CAD recovery toward 1.38 to 1.39 as dollar strength fades.
USD/CHF at 0.7930 is the more nuanced read. The Swiss franc is simultaneously a safe-haven currency that benefits from geopolitical stress — which is fading — and a low-yield currency where the enormous Fed-versus-SNB rate gap (3.50 to 3.75% versus 0.25%) provides structural USD support. As geopolitical stress fades, the safe-haven CHF bid weakens, which pushes USD/CHF higher. But a dovish Warsh that signals rate cuts approaching would compress the Fed-SNB gap and pull USD/CHF lower. The net at today’s levels is that the pair is in genuine equilibrium — both forces roughly balanced — which is why it is barely moving in the pre-FOMC session.
2:00 PM ET. The Dot Plot. Then 2:30 PM ET.
The sequence matters. At 2:00 PM: the decision (hold, near-certain) and the Summary of Economic Projections including the dot plot. The dots are the first data point — if the median dot shows zero cuts for 2026 (down from two) and some dots show hikes, the long-end yield spikes immediately and risk assets come under pressure before Warsh even speaks. At 2:30 PM: the press conference. This is where tone overrides data — where Warsh’s framing of the Iran deal, the oil collapse, and the retail beat determines whether the hawkish dots get softened by dovish language or reinforced by a new Chair establishing anti-inflation credibility.
The 20-year yield at 5.05% is sitting at the level that historically makes equity investors uncomfortable about valuations. A move above 5.20% on hawkish dots would be the S&P 500’s most significant headwind. A move below 4.90% on dovish language would be the catalyst for the record test. Know which of those scenarios your positions are sized for — and have the orders in before 2:00 PM.
─
Read Full Report: capitalstreetfx.com/market-analysis/daily-market-analysis/

Comments
No comments yet. Be the first to share your thoughts!
Authentication Required
You must be logged in to post a comment.