Yen Crosses 160, BOJ Rate-Hike Odds Surge as Nikkei Slips Friday, 5 June 2026 | Asian Session Report | Capital Street FX

The Yen Is the Story
Friday’s Asian session opens with a single dominant narrative: the Japanese yen is in crisis, and Tokyo is running out of patience.
USD/JPY crossed 160 per dollar intraday — the threshold that previously triggered $73 billion in official intervention — before verbal warnings from Finance Minister Satsuki Katayama pushed it fractionally back to 159.87, up 0.15% on the session. Markets are not convinced. The probe is deliberate. Traders have tested this ceiling before and found it painful. They are testing it again.
What makes today different from previous yen-weakness episodes is the paradox sitting beneath the surface. At the exact moment the yen is depreciating toward intervention levels, BOJ rate-hike expectations are intensifying. Japan’s real wages rose for a fourth consecutive month — the domestic demand evidence that BOJ Governor Ueda has repeatedly cited as the precondition for further tightening. Markets now assign a meaningful probability to a BOJ rate hike at the June 16–17 meeting, which would mark the second hike of 2026 and the first time since 2018 that the Fed and BOJ would be tightening simultaneously.
The irony is sharp: a BOJ hike — which would normally strengthen the yen — could theoretically eliminate the very condition that makes intervention necessary. But before that hike arrives, the market has to survive tonight’s U.S. Non-Farm Payrolls, and that is where every trade in this session ultimately leads.
The Nikkei’s AI Rout — SoftBank’s Worst Day Since 2020
The Nikkei 225 extended its Thursday decline, falling a further 1.28% to 66,636 in early Tokyo trade. The damage is concentrated but severe. SoftBank Group collapsed 11.3% — its worst single-day loss since 2020 — as its heavy exposure to AI-related investments, including Arm Holdings and OpenAI, became a liability rather than an asset.
The trigger was Broadcom. Disappointing quarterly guidance from the U.S. chip giant sparked a global selloff in AI and semiconductor names that swept through Asian markets with unusual force. SoftBank, as Japan’s largest-market-cap stock and the single biggest concentration of AI investment risk on the Nikkei, absorbed the worst of it. The damage radiated outward: Tokyo Electron fell 5.6%, Advantest dropped 4.4%, and Murata shed 2.2%.
This is not simply a Japan story. It is a global repricing of AI-infrastructure valuations that began in the United States on Thursday and is completing its circuit through Asia on Friday morning.
Australia: A Different Kind of Friday
While Japan absorbs punishment, Australia is positioned for a tentative recovery. SPI futures are pointing to the ASX 200 opening 32 points higher, placing the index around 8,622.4 — a gain of approximately 0.35%. The overnight catalyst is a combination of gold’s rebound to $4,507 and the Dow Jones closing up 1.7% on Wall Street.
The picture is not entirely clean. WTI crude pulled back 3% to $93.15, which creates headwinds for energy-sector heavyweights Santos and Woodside. But for gold miners such as Evolution Mining and Newmont, the overnight move is unambiguously positive. Paladin Energy led Thursday’s ASX 200 gainers with a surge of over 10% on uranium demand.
The session’s most notable corporate event is Megaport resuming trade after a $518 million capital raise priced at $14.30 per share — a 13.9% discount to market. A 99% take-up rate from institutional investors is a strong signal of confidence in the AI infrastructure theme, even as Nikkei-exposed AI names suffer.
Silver’s Sharp Reversal
Silver has surged 1.6% to $72.72 in early Asian trade, a sharp reversal from Thursday’s selloff. Silver’s 52-week range of $31.64 to $121.67 represents one of the most extraordinary commodity runs in decades — a 144.9% annual gain fuelled by the global industrial electrification supercycle and safe-haven demand during the Iran conflict. The metal has since corrected nearly 39% from its 2026 high of $121.67. Thursday’s session printed a low of $72.45 — the strongest intraday support in weeks — and today’s 1.6% bounce from that level is consistent with a technically oversold recovery.
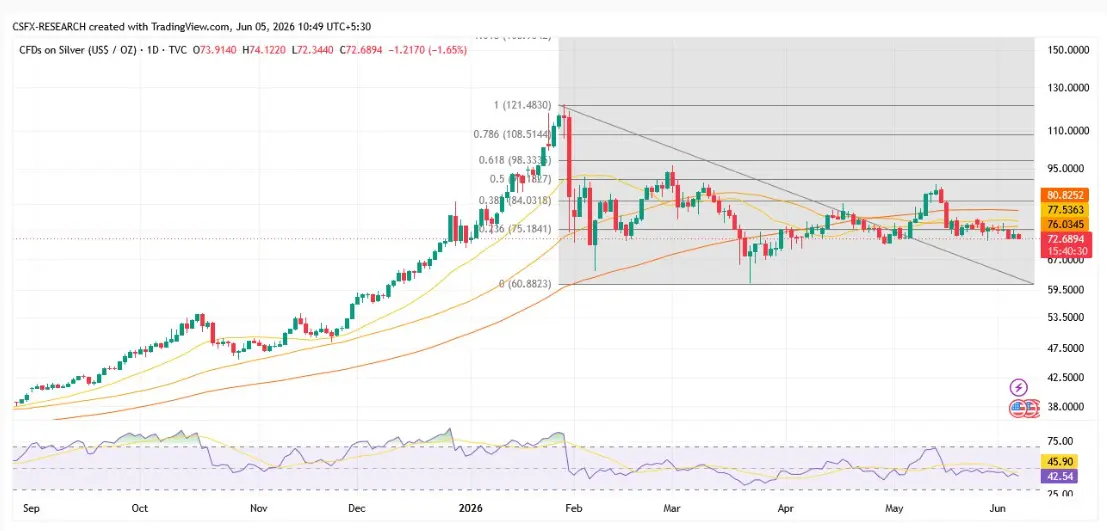
The fundamental picture is contradictory. Rising interest-rate expectations — driven by the Iran energy shock — are pressuring a non-yielding metal. Cleveland Fed’s Beth Hammack has warned that rates may need to rise if energy-driven inflation intensifies. But Silver’s industrial demand from Asia, particularly Japan’s electronics sector and Chinese solar panel manufacturing, remains structurally elevated.
Technical Analysis and Trade Signal — Silver XAG/USD: The daily RSI was deeply oversold before today’s bounce, increasing the probability of a multi-session mean-reversion rally of $3 to $5 per ounce. Key resistance sits at $75.00 to $75.50, the prior session’s breakdown zone, and then $79.00 to $80.00, which was last week’s support-turned-resistance. The tactical trade is a long on today’s Asian bounce, entering near $73.50 on a pullback toward intraday support, with a stop loss placed below Thursday’s Asian session low at $72.00. The take profit target is $77.50, near the prior breakdown zone resistance. Any Iran ceasefire progress would reduce inflation fears and could trigger a sharper reversal well beyond that level.
Natural Gas: Iran Premium and Asian LNG Demand
Natural gas is grinding higher at $3.35, up 0.9% on the session. The near-closure of the Strait of Hormuz has kept energy prices elevated and is now directly fuelling LNG demand from Singapore and South Korea. Singapore has already secured alternative LNG supplies, confirming the shift toward Asian LNG demand as a structural driver. South Korea and Japan — both heavily dependent on LNG imports — are active buyers at current levels. Trump’s use of Cold War-era emergency powers to reroute gas supply chains adds an additional geopolitical premium.
Technical Analysis and Trade Signal — Natural Gas NG Futures: The $3.10 level held perfectly as structural support on Thursday’s dip, and the bounce back to $3.35 confirms that floor with conviction. Resistance sits at $3.40 in the short term, then $3.55 to $3.60, the May consolidation peak. If the Iran situation escalates, natural gas has a credible pathway toward $3.80 to $4.00. The trade setup is a long on any pullback into the $3.10 to $3.20 participation zone, with a stop loss below the structural support at $3.05. The take profit target is $3.55, the prior resistance band from May. Price is above support, trending higher, with strong volume confirmation on recent dips. The $3.10 to $3.25 zone is accumulation territory for patient longs.
Crypto: Ethereum’s Deepest Oversold Since 2022
Ethereum has fallen to $1,731.32, down 3.18% on the session. The RSI has plunged to 18 — the deepest oversold reading since the 2022 crypto winter. The all-time high of $4,953.73, reached in August 2025, now feels like a different market entirely. Ethereum is 64.1% below that peak.
Co-founder Vitalik Buterin’s earlier large ETH sales in early 2026 added supply pressure and damaged confidence. The BTC-ETH-S&P500 correlation remains elevated at approximately 0.74, meaning the Broadcom-led tech selloff is directly pulling crypto lower. The Cleveland Fed’s hawkish comments on potential rate hikes are raising the opportunity cost of holding non-yielding digital assets.
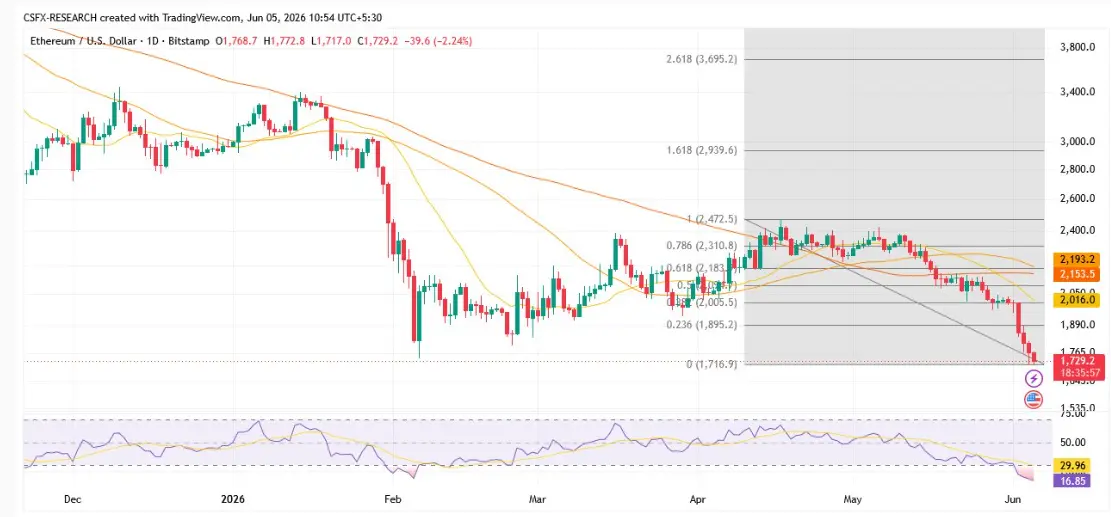
Technical Analysis and Trade Signal — Ethereum ETH/USD: The descending resistance line visible throughout May has confirmed a lower-high structure, and all major moving averages — the 50-day EMA at $1,918, the 100-day at $1,955, and the 200-day at $1,997 — are stacked above price in a classic bearish formation. High-volume breakdowns signal genuine institutional selling rather than retail panic, and these patterns typically have more follow-through. The RSI at 18 increases the statistical probability of a technical bounce toward $1,880 to $1,920, but this should be viewed as a short-selling opportunity rather than a reversal signal unless volume structure changes. The trade is to short bounces toward the 20-day EMA at $1,880, entering near $1,820, with a stop loss above the 50-day EMA resistance at $1,920. The take profit target is $1,600, the next meaningful demand zone from prior market history. The structural bull case for ETH — institutional ETF inflows, DeFi adoption, EIP-4844 fee reductions — remains intact but is being overwhelmed by macro-driven selling.
Chainlink is following an identical path, falling 3% to $7.81 and down 16% from its 7-day high of $9.29. The Fear and Greed Index sits at 28, confirming widespread risk aversion across the altcoin complex. Chainlink’s oracle infrastructure, which feeds real-world data to smart contracts across more than 10 blockchains, remains fundamentally sound — with 14 new integrations reported in recent weeks — but fundamentals are irrelevant in a risk-off macro environment.
Technical Analysis and Trade Signal — Chainlink LINK/USD: The chart shows a clean descending structure: lower highs, lower lows, with the 20-day EMA now acting as resistance near $8.30. The $7.81 level is critical — a sustained break below it with volume could accelerate the selloff toward $7.00 to $7.20, the next structural support. The tactical approach is to short bounces, entering near $8.10, with a stop loss above key moving average resistance at $8.70. The take profit target is $7.20, the support base from prior consolidation. Avoid buying into weakness; wait for $7.81 to hold with volume confirmation before considering any reversal trade.
Foreign Exchange: The Two Trades That Matter
Two currency pairs define the FX landscape this session, and both involve the yen.
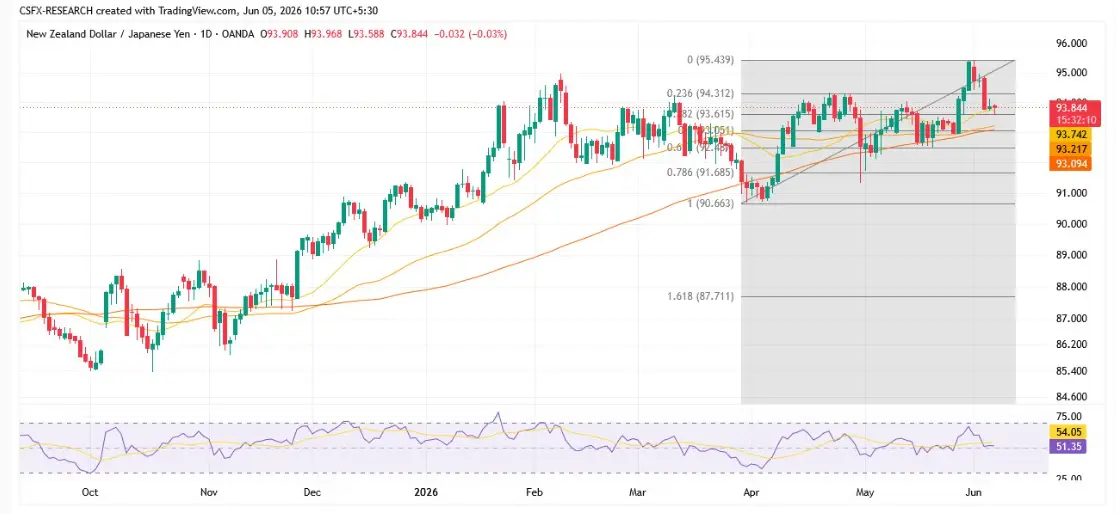
NZD/JPY opened at 93.30 and has pulled back to 93.07, down 0.25% on the session. The pair is a textbook risk-appetite barometer — it rallies when global equities surge and sells off when equities fall or the yen gains safe-haven flows. Today, both bearish forces are converging simultaneously. The Nikkei’s 1.28% drop, SoftBank’s collapse, and the Broadcom AI selloff are weighing on risk appetite, while Japan’s fourth consecutive monthly real wage increase is giving the BOJ the data it needs to justify a June hike. The RBNZ, meanwhile, sits in easing mode at 3.50%, putting the interest-rate differential firmly against the New Zealand dollar.
Technical Analysis and Trade Signal — NZD/JPY: The pair sits in the lower half of its 52-week range of 79.81 to 95.40, with the 52-week high acting as firm overhead resistance. Key support sits at 92.63, today’s Asian low, and then 91.50, the major May consolidation area. A clean break below 92.63 opens a run toward 91.00 to 91.50. A reversal above 93.80 to 94.00 would require a simultaneous deterioration in BOJ hawkishness — unlikely today. The trade is short NZD/JPY near the open at 93.30, with a stop loss above the recent 3-day high at 94.20, targeting 91.50 into the NFP release.
USD/JPY at 159.87 is caught between two powerful and contradictory forces. The Fed’s rate hold at 3.50 to 3.75% and sticky U.S. inflation are structurally dollar-positive — USD yields approximately 4.5% against near-zero Japanese rates. But Japan’s real wage data has dramatically upgraded BOJ rate-hike probabilities for the June meeting. The Finance Ministry’s credible intervention threat provides a hard ceiling near 160.
Technical Analysis and Trade Signal — USD/JPY: The pair briefly crossed 160 intraday on Thursday before verbal warnings from Finance Minister Katayama pushed it back. Support sits at 158.50, the weekly low, and 157.80, the May consolidation band. Short-term RSI is approaching overbought on 1-hour charts with bearish divergence forming. The setup is a classic asymmetric risk trade: limited upside above 160 where intervention risk is extreme, meaningful downside on a BOJ hike surprise or weak NFP print. The trade is short USD/JPY near 159.90, fading the 160 ceiling, with a stop loss above the intervention trigger zone at 160.60 and a take profit target at 157.80. Tactically short into NFP with defined risk.
ASX 200: Technical Setup for the Open
The ASX 200 fell 1.1% on Thursday to 8,686, but SPI futures are pointing to a 0.35% recovery open around 8,622.4. Thursday’s drop was driven by the energy sector’s reaction to the WTI oil pullback and the Nikkei rout spreading regionally.
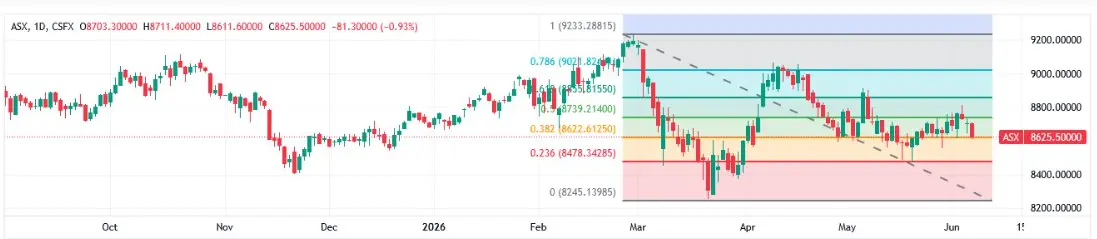
Technical Analysis and Trade Signal — ASX 200 XJO: The structural support zone at 8,640 to 8,660 held intraday on Thursday, confirming this as a meaningful floor. Key resistance levels are 8,750, near the 50-day moving average, and 8,820, the June high. A clean break above 8,750 on sustained volume would confirm a recovery momentum shift. Healthcare, financial and telco sectors — which outperformed on Wall Street overnight — are the catalysts to watch for session breadth. The trade is a long CFD entry near 8,695 on an early pullback from the open, with a stop loss below Thursday’s close support at 8,640 and a take profit target at 8,780, the pre-selloff highs and resistance band. As a commodity-heavy index, the ASX has direct sensitivity to gold’s overnight gain of 0.9% — bullish for gold miners — and oil’s 3% pullback, which weighs on energy names.
All Roads Lead to Tonight’s NFP
The Asian session on 5 June 2026 is characterised by a single organising tension: every position, every technical level, and every central bank calculation is being held in suspension ahead of tonight’s U.S. Non-Farm Payrolls release.
The forecast sits at 85,000 jobs, against a prior reading of 115,000. A print below 70,000 could force a Fed dovish pivot — strengthening the yen, triggering risk-on flows into the ASX and NZD, and potentially delivering a technical bounce in oversold crypto. A strong print keeps the dollar bid, maintains pressure on the yen, and may force Tokyo’s hand on intervention. The outcome is genuinely binary. Reduce position sizes by 30 to 50% ahead of the release to account for event-driven volatility.
Before NFP arrives, the session’s other key events include BOJ Governor Ueda’s speech — where any hawkish language on rate hikes would immediately strengthen the yen and accelerate the Nikkei’s decline — and China’s Caixin Services PMI for May, where a strong print supports the Australian dollar and ASX materials sector, while a miss adds further weight to the commodities complex.
Japan’s monetary policy paradox — a weakening yen meeting rising rate-hike expectations — is the most interesting structural tension in global markets today. The yen crosses 160. The BOJ watches the data. Finance Minister Katayama issues warnings. And everyone waits for a payrolls number that could reset every trade discussed above.
Full report available at Capital Street FX: https://www.capitalstreetfx.com/market-analysis/yen-at-160-boj-rate-hike-odds-rise-nikkei-slips-technical-analysis-asian-session-5-june-2026/

Comments
No comments yet. Be the first to share your thoughts!
Authentication Required
You must be logged in to post a comment.