Daily Analysis 5 June 2026 | Dollar Strength, Oil Rally And NFP In Focus

Currency & Commodity Analysis:
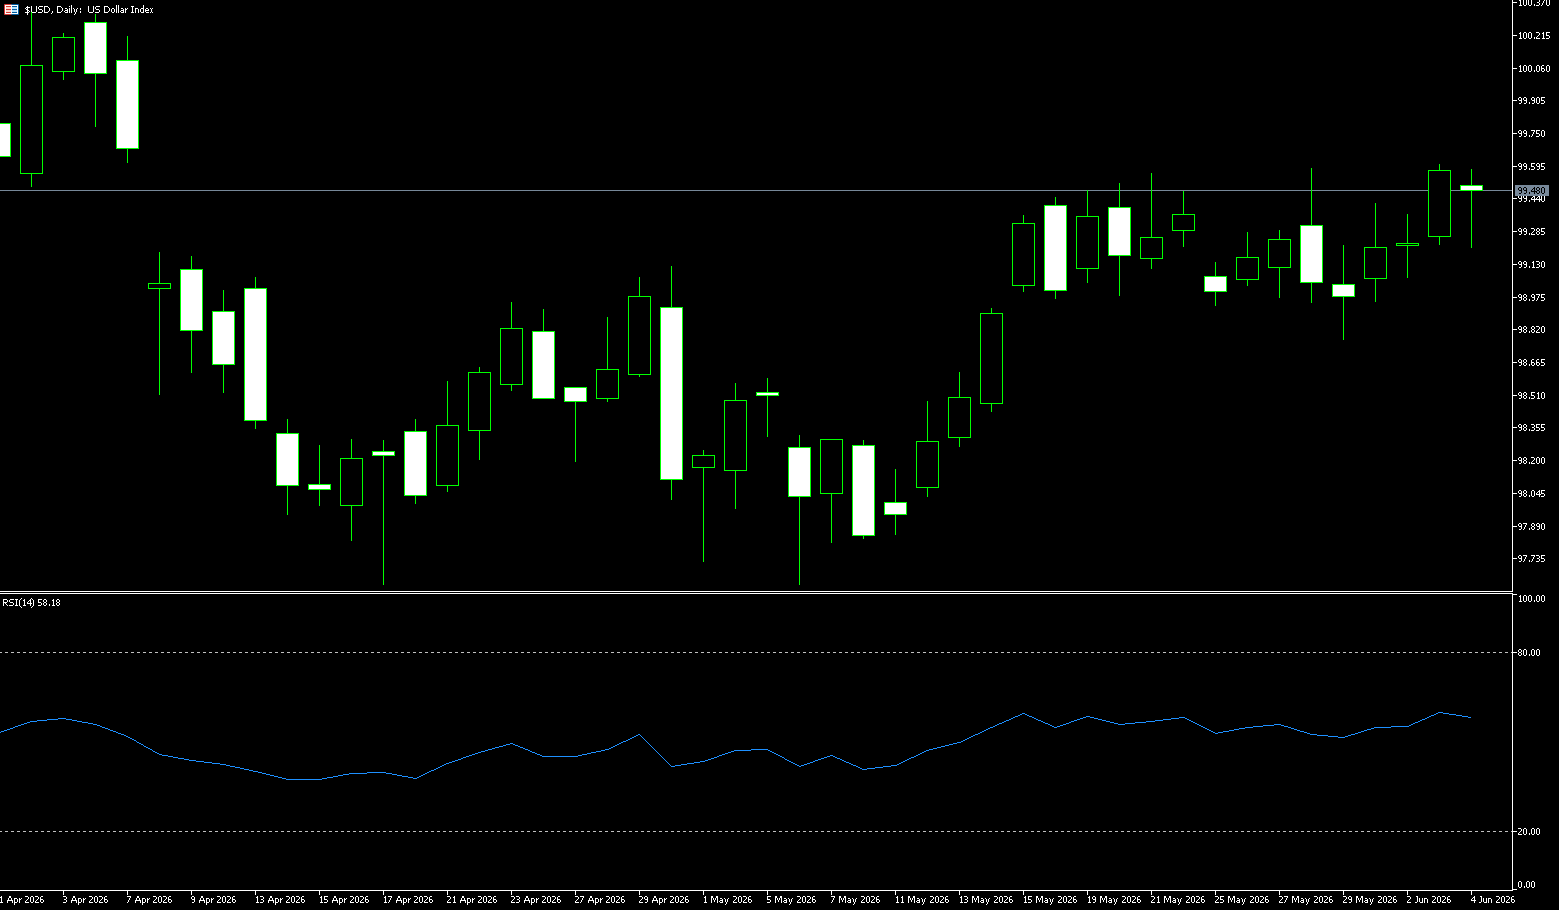
US Dollar Index
The US dollar index traded around 99.40 on Thursday, near a two-month high, as stronger-than-expected US labor market data reinforced expectations of a tightening Federal Reserve policy. The latest ADP report showed that private sector employment increased by 122,000 in May, exceeding expectations and marking the strongest reading since January 2025. Earlier this week, Jolts data revealed that job openings rose to their highest level since November 2024 in April. Investors are now awaiting Friday’s non-farm payroll report for further insight into labor market conditions. The dollar also continues to be supported by escalating tensions in the Middle East, which have kept oil prices high and added to inflationary pressures. The market currently assesses an 85% probability of a 25 basis point rate hike by the Fed before the end of the year, up from 60% a week ago.
After months of consolidation near multi-month lows, the US dollar index may be entering a broader recovery phase. If inflation remains high and the Middle East conflict continues to disrupt energy markets, the likelihood of the US dollar returning above the 100.00 level in the coming weeks will increase. The US dollar index is currently trading near a high of 99.50, with short-term resistance at the previous high of 99.55. The medium-term resistance is at 100.00 (a psychological level), while support lies at the psychological level of 99.00 and the 99.18 area (the 9-day moving average). The MACD remains above the zero line, with the DIFF above the DEA, indicating a slight continuation of bullish momentum. The RSI is at 58, above the 50 level, indicating bullish dominance but not yet overbought.
Today, consider shorting the US dollar index at 99.52, with a stop-loss at 99.65 and targets at 99.20 and 99.10.
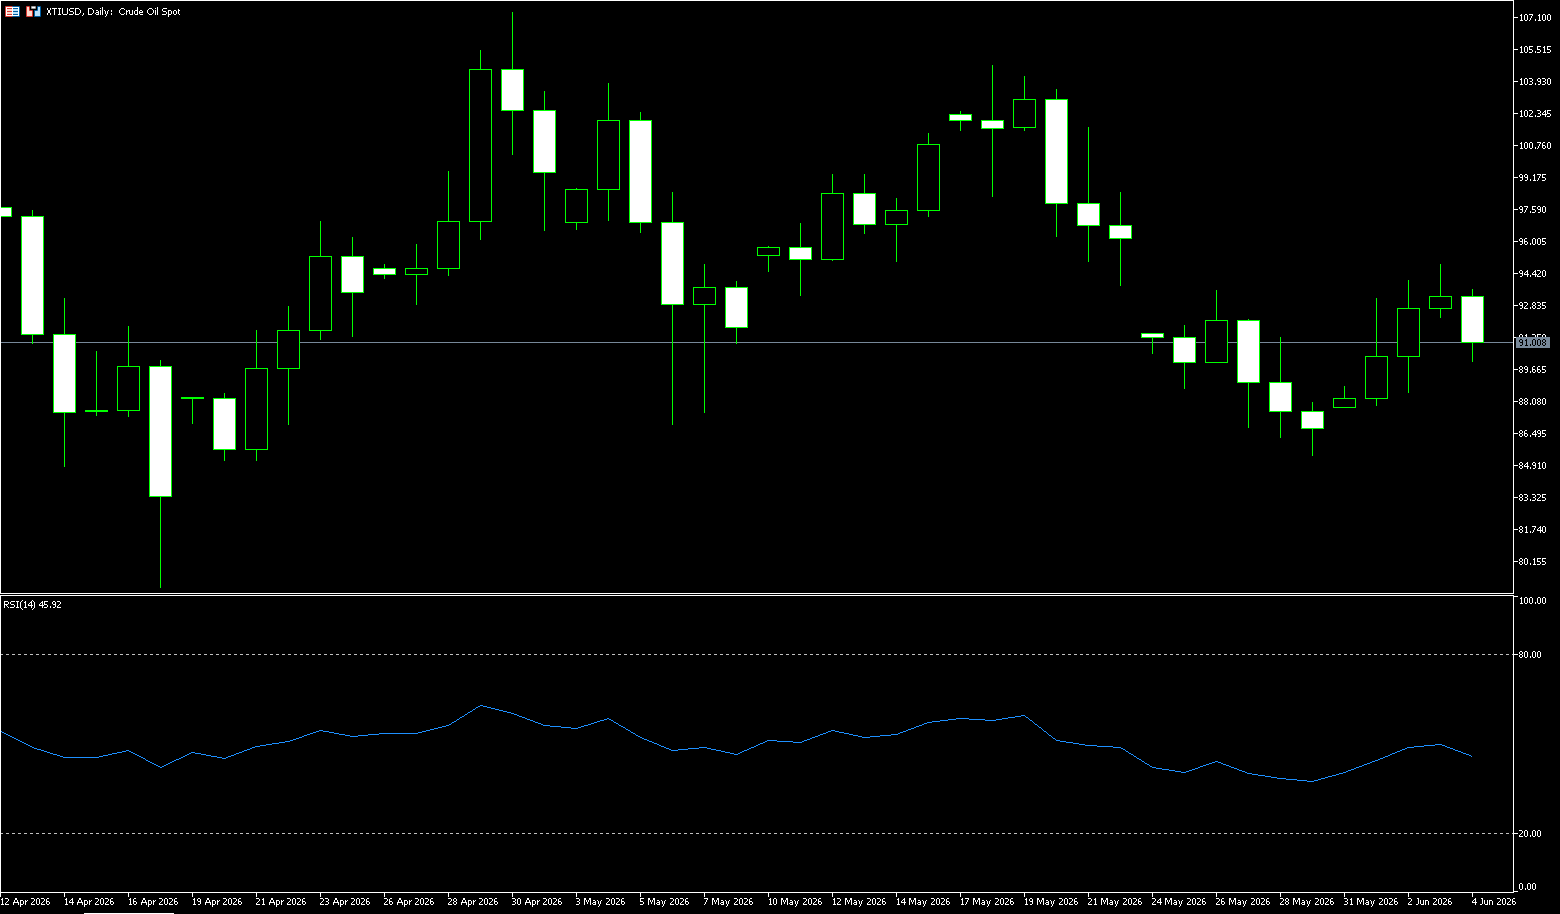
WTI Crude Oil
WTI crude oil traded around $91.00 per barrel on Thursday. The agreement between Lebanon and Israel to implement a ceasefire and establish a pilot zone limited price gains. EIA data showed a significant weekly decrease of 8 million barrels in US crude oil inventories, double the expected decline. Meanwhile, the US-Iran conflict entered its fourth month, with multiple pressures pushing both Brent and WTI crude oil prices close to key psychological levels. Oil prices strengthened for the third consecutive trading day on Wednesday as tensions escalated in the Middle East, with Trump stating that the naval blockade against Iran could continue until September. The Iranian conflict is the fundamental narrative behind this round of oil price movements. The conflict has lasted four months, and there have been no signs of substantial negotiations between the US and Iran to date. Major buyers in Asia and Europe continue to seek alternative supply channels to replace the blocked oil flows from the Middle East, which is the direct reason why US exports have remained at historically high levels and the underlying logic behind this week’s larger-than-expected inventory decline. Brent crude oil has historically been more sensitive to the situation in Iran than WTI, and the persistent price difference between the two is itself a pricing reflection of a geopolitical premium. As long as the negotiating table remains empty, this premium is unlikely to dissipate.
From a price structure perspective, WTI crude oil is testing the 50-day moving average at $95.03, while the $100 level holds strong psychological significance for both bulls and bears—it’s a strong defensive position for bears and a key target for bulls. If it can effectively break through this level, the next target is $104.74 (the high of May 18th); this area presents some resistance but does not constitute a “ceiling” signifying the end of the trend. On the other hand, $90 is a proven strong psychological support level; a break below this level would test $86.38 (the 89-day moving average). Short-term pullbacks should be seen as buying opportunities rather than signals of a trend reversal.
Today, consider going long on crude oil at 90.50, with a stop loss at 90.30 and targets at 93.00 and 92.00.
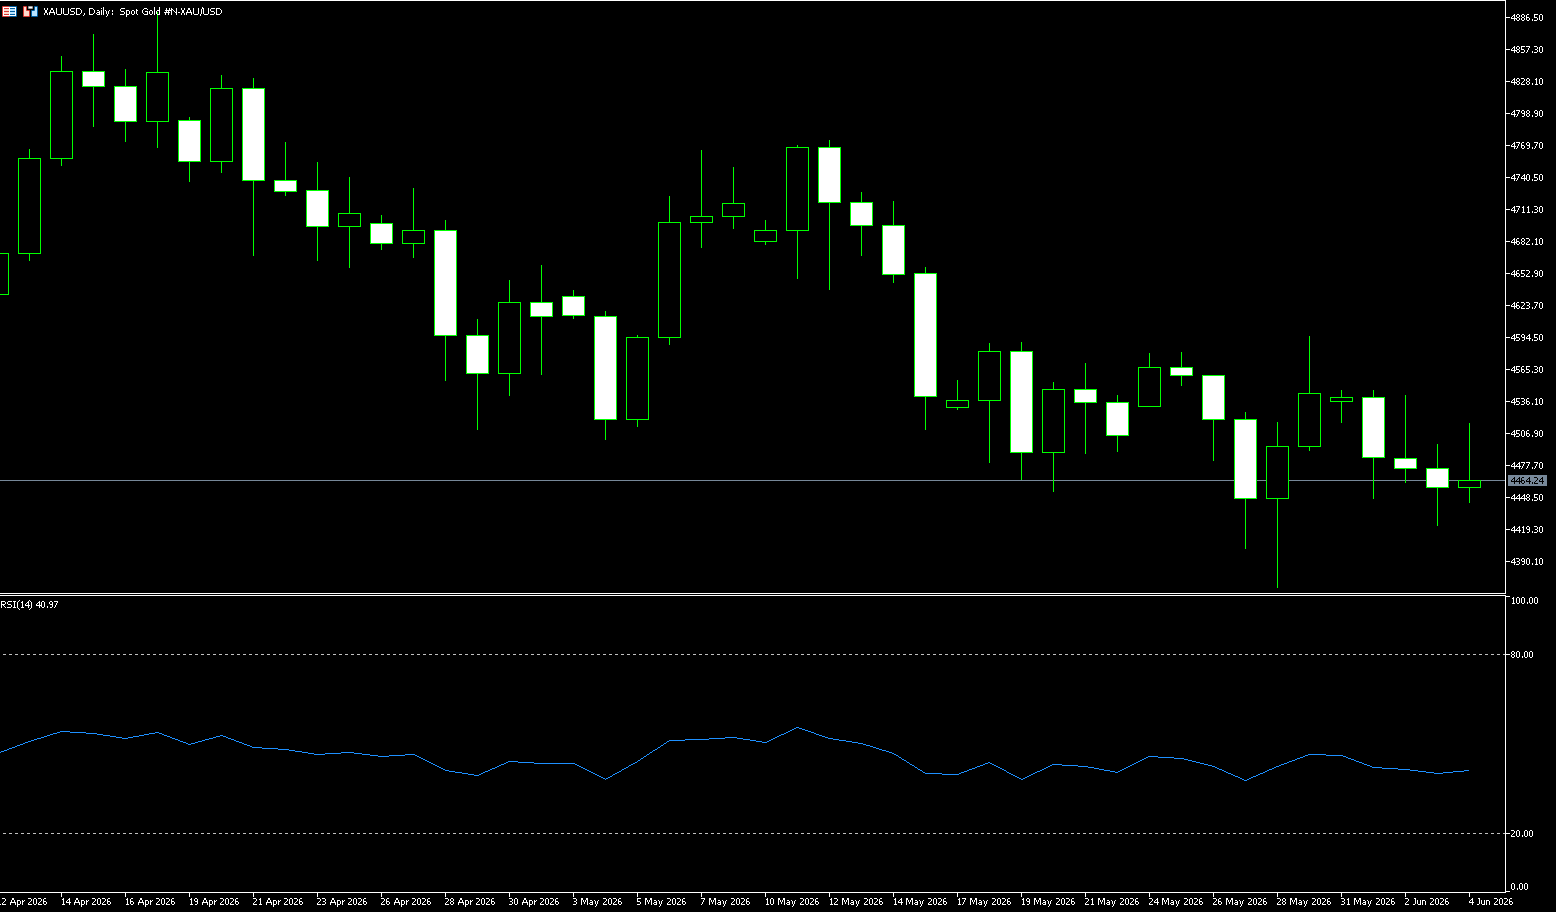
Spot Gold
On Thursday morning, spot gold traded around $4,460 per ounce. Although gold prices briefly approached the $4,500 per ounce mark on Wednesday, escalating tensions in the Middle East and inflation concerns led the market to bet on high interest rates, keeping gold prices below $4,500 per ounce. The ongoing geopolitical conflict in the Middle East is the source of both crude oil prices and inflation expectations, and a significant factor contributing to the short-term weakness in gold. Dragged down by historically high gold prices, global central bank net gold purchases in 2025 are projected to fall to 850 tons, a significant slowdown compared to the average annual purchases of over 1,000 tons from 2022-2024. High gold prices are compressing central banks’ willingness to increase gold purchases, but the total annual purchase volume still far exceeds the historical average before the outbreak of the Russia-Ukraine conflict. Amidst the normalization of geopolitical conflicts, global central bank gold operations have exhibited a clear polarization, with some countries aggressively hoarding gold while some energy-exporting nations are passively selling it, directly exacerbating short-term gold price volatility.
Technically, the daily chart shows spot gold around $4,445/oz, still close to the lower Bollinger Band. The Bollinger Band middle band is at $4,556.50/oz, the upper band at $4,729.10/oz, and the lower band at $4,374.60/oz. The price has consistently traded below the middle band, indicating that the daily rebound has not yet reclaimed the trend center. The previous highs of $4,773.30/oz and $4,595.10/oz form a progressively lower structure, with the $4,300-$4,366/oz range serving as recent low anchors. Regarding the MACD, the DIFF is -54.17 and the DEA is -49.77, with the histogram still in negative territory, indicating that downward momentum has not yet fully recovered. The convergence near the lower Bollinger Band suggests a potential reactivation of volatility, but the direction depends on whether fundamental catalysts can break the tug-of-war between safe-haven support and interest rate suppression.
Consider going long on gold today at 4,470, with a stop-loss at 4,465 and targets at 4,500 and 4,520.
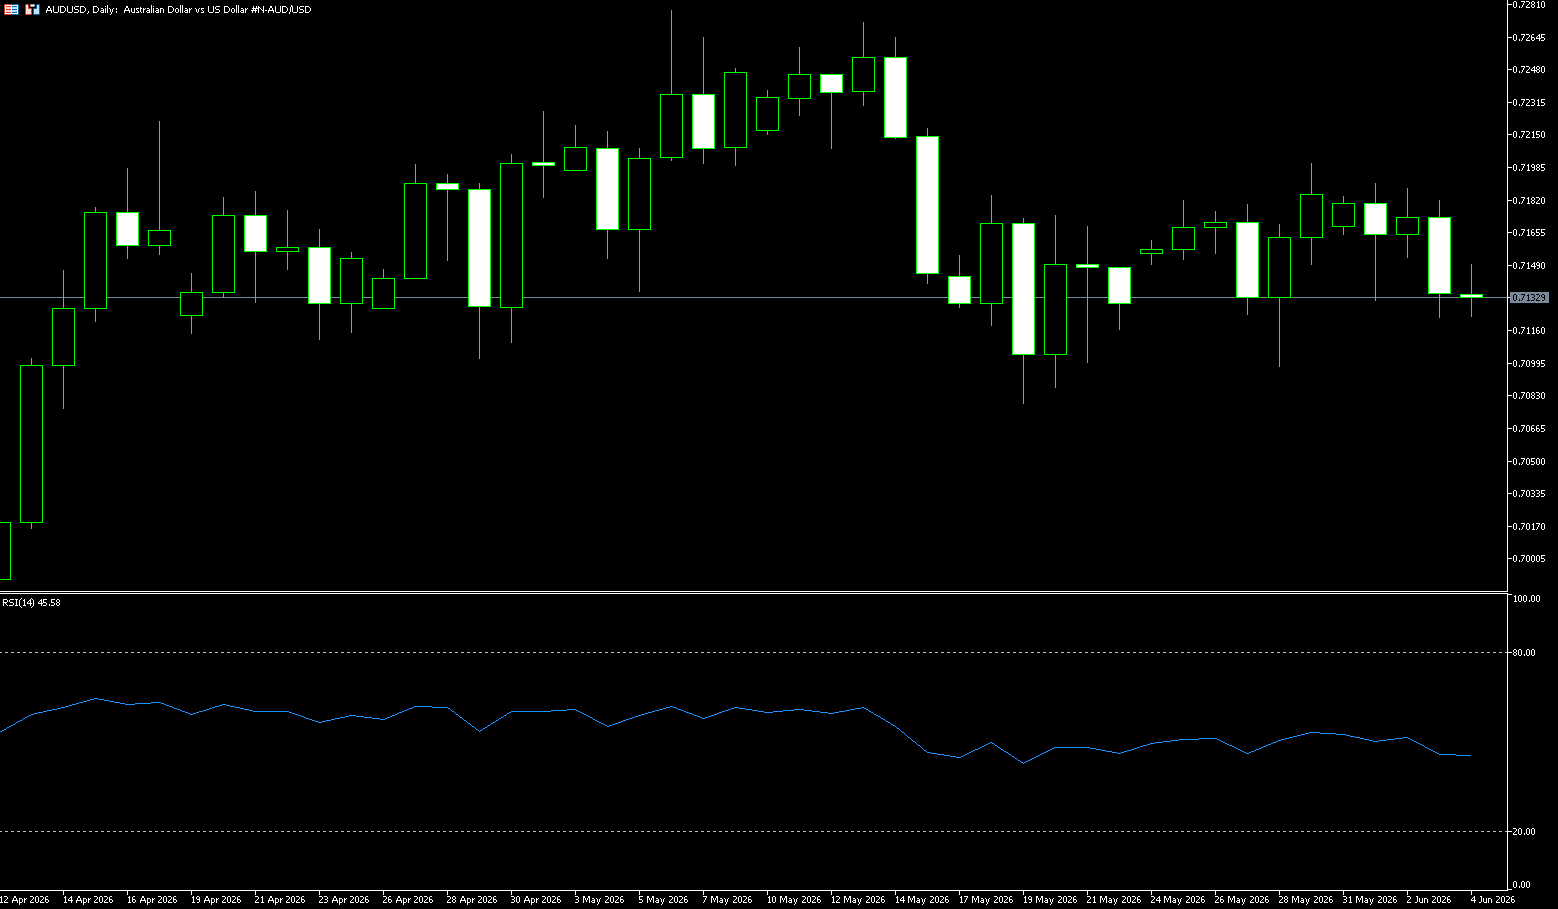
AUD/USD
In early Asian trading on Thursday, the Australian dollar rose to approximately 0.7135 against the US dollar. The Australian dollar edged higher against the US dollar due to domestic trade balance data. The US May non-farm payrolls report will be the focus of the market later on Friday. According to data released by the Australian Bureau of Statistics (ABS) on Thursday, Australia’s trade balance turned into a monthly surplus of US$1,791 million in April, from a deficit of US$1,024 million in the previous month (revised to a deficit of US$1,841 million). Meanwhile, Australian exports rose 7.2% month-on-month in April, after a 2.5% decline in the previous month (revised to -2.7%). The improved trade balance data may indicate strong export demand or a resilient economy. This report may lead the market to expect the Reserve Bank of Australia to raise interest rates or maintain high rates, thus supporting the Australian dollar. On the other hand, continued tensions in the Middle East and the lack of progress on a US-Iran peace agreement may boost the safe-haven currency, the US dollar.
On the daily chart, the Australian dollar is trading at 0.7130 against the US dollar, maintaining a constructive short-term bullish bias as it remains above key moving averages. The 55-day, 100-day, and 200-day simple moving averages are at 0.7108, 0.7066, and 0.6826 respectively, all below the current price, indicating that even with some cooling momentum, the overall rebound structure remains intact. The Relative Strength Index (RSI) hovers below the neutral 50 line, while the Average Directional Index (ADX) suggests the trend remains fragile. On the downside, the recent pivot point is around 0.7108, reinforced by nearby horizontal support at 0.7079 and the 100-day simple moving average at 0.7066. A break below this support zone would expose the next demand zone around 0.7000 (a psychological level). Initial resistance is located at 0.7190 (this week’s high), adjacent to the horizontal resistance zone around 0.7200. A sustained break above this zone would pave the way for the next higher resistance level at 0.7270.
Consider going long on the Australian dollar at 0.7122 today, with a stop loss at 0.7110 and targets at 0.7180 and 0.7190.
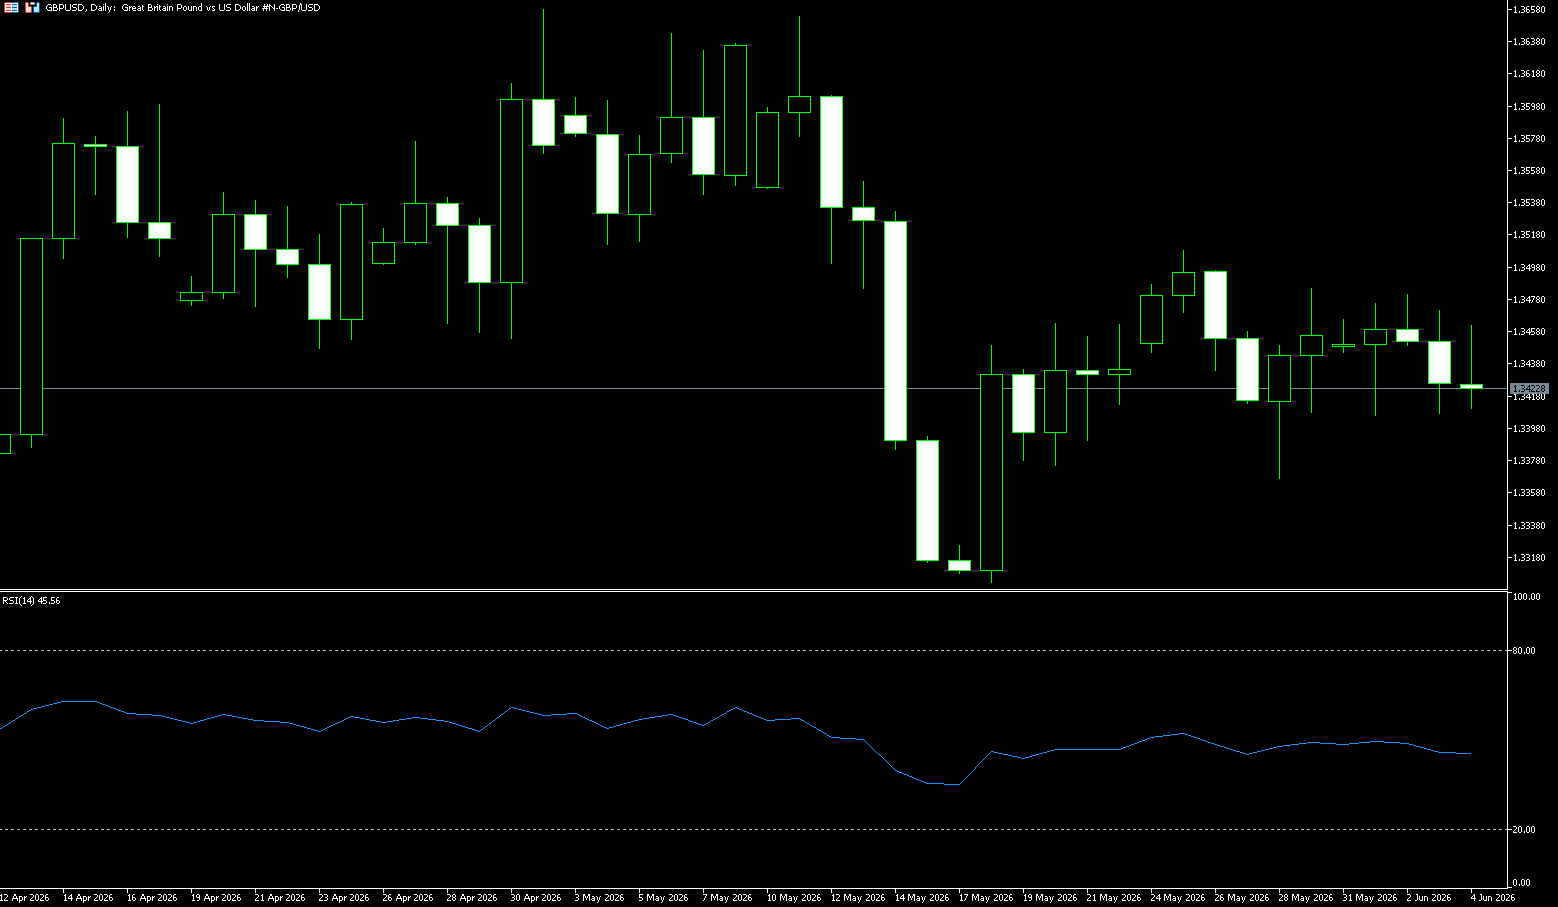
GBP/USD
GBP/USD attracted some bargain hunting during Thursday’s Asian session, trading above the 1.3400 level after falling near its weekly low the previous day. A weaker dollar was the main driver of the gains, although the upside appears limited against the backdrop of ongoing geopolitical uncertainty. Renewed hostilities in the Gulf region keep geopolitical risks alive and should limit further dollar declines, thus caution is advised when making aggressive long bets on this pair. Furthermore, market bets on a Fed rate hike in 2026 should support the dollar and limit downside for GBP/USD. Traders may also choose to remain on the sidelines ahead of Friday’s closely watched US monthly jobs data, which will provide further clues about the Fed’s future policy path. The fundamental backdrop appears to favor a dollar bullishness, suggesting that GBP/USD may attract new selling pressure at higher levels.
The daily chart shows that the British pound fell from 1.3657 to 1.3302 against the US dollar, a cumulative correction of 355 pips, and recently rebounded to around 1.3480, recovering only about 45% of the previous decline. The Bollinger Band middle line is at 1.3460, and the current price is still 35 pips below it; the upper band is at 1.3600 and the lower band is at 1.3320, reflecting a downward shift in the trading range. The MACD DIFF is -0.0009, DEA is -0.0008, and the histogram is -0.0001, indicating weakening downward momentum, but a medium-term momentum reversal has not yet formed. In other words, the market is transitioning from position repair after the previous sharp drop to a phase of pricing in fundamental evidence one by one. The first upside target is 1.3477 (100-day moving average), followed by the 1.3500 (psychological level). On the downside, watch the 1.3400 (psychological level) and 1.3367 (last week’s low).
Consider going long on GBP at 1.3413 today, with a stop loss at 1.3400 and targets at 1.3470 and 1.3460.
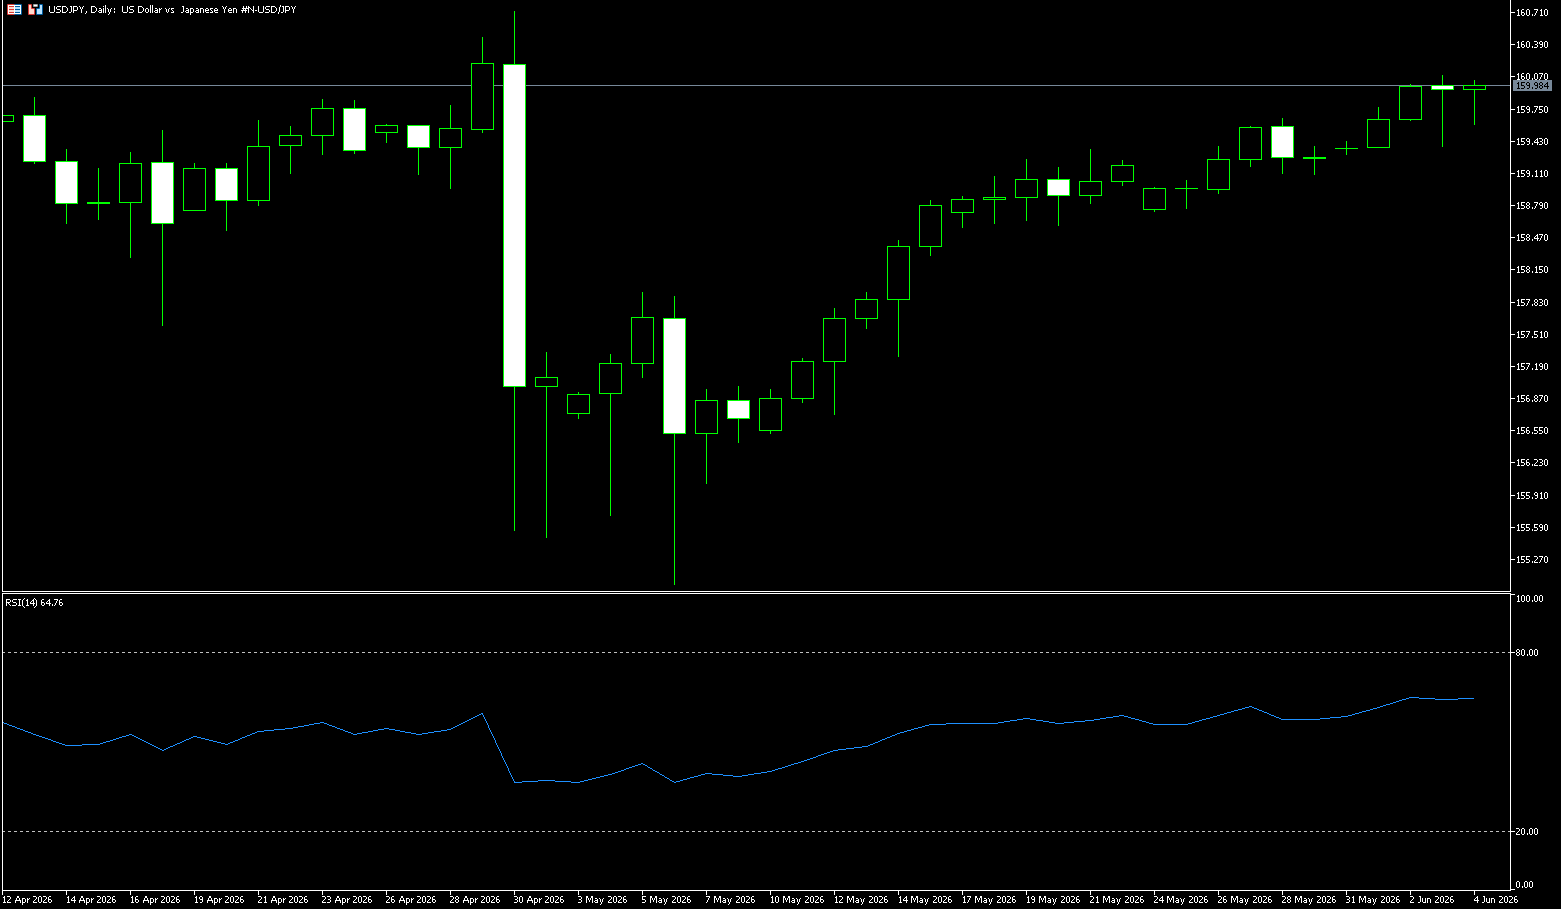
USD/JPY
USD/JPY ended a four-day winning streak, trading around 159.90 on Thursday. Risk aversion eased as Israel and Lebanon agreed to resume a ceasefire on Wednesday, weakening the dollar and causing the pair to depreciate. However, this requires a complete cessation of fire by Hezbollah, backed by Iran. The agreement was announced in a joint statement following US-led negotiations in Washington. Japan faces a potential “historic yen collapse” driven by prolonged oil price volatility and loose fiscal policy. In response, Noji urged policymakers to adopt a coordinated three-pronged approach, including interest rate hikes, halting fiscal expansion, and further market intervention, arguing that no single measure can solve the crisis alone. Meanwhile, Finance Minister Satsuki Katayama declined to comment on specific currency movements or recent intervention data, but emphasized that continued volatility in the energy market requires Japan to remain prepared for “appropriate action.”
Technical charts show that the USD/JPY pair is within an upward trend channel on the 4-hour chart, but momentum is showing signs of weakening. The exchange rate is trading above the Bollinger Band middle line at 159.75, with the lower band at 159.34 acting as key support; a break below this level could weaken the trend. In terms of candlestick patterns, the previous period was dominated by bullish candles, but small-bodied candles and doji stars have appeared at higher levels, indicating weakening bullish momentum. The MACD indicator shows a bearish divergence: when the price made new highs, the DIFF line failed to rise in tandem, and the histogram contracted to a low level, suggesting a “last gasp” characteristic. Although a second golden cross has appeared above the zero line, the overall momentum is significantly weaker than the previous peak. Short-term strong resistance is at 160.17 (upper Bollinger Band), a break above which could open up space to 160.50-161.00; short-term support is at 159.34 (lower Bollinger Band), a key level to watch, a break below which would test the 159.00 level.
Consider shorting the US dollar today at 160.20, stop loss: 160.40, target: 159.30; 159.20
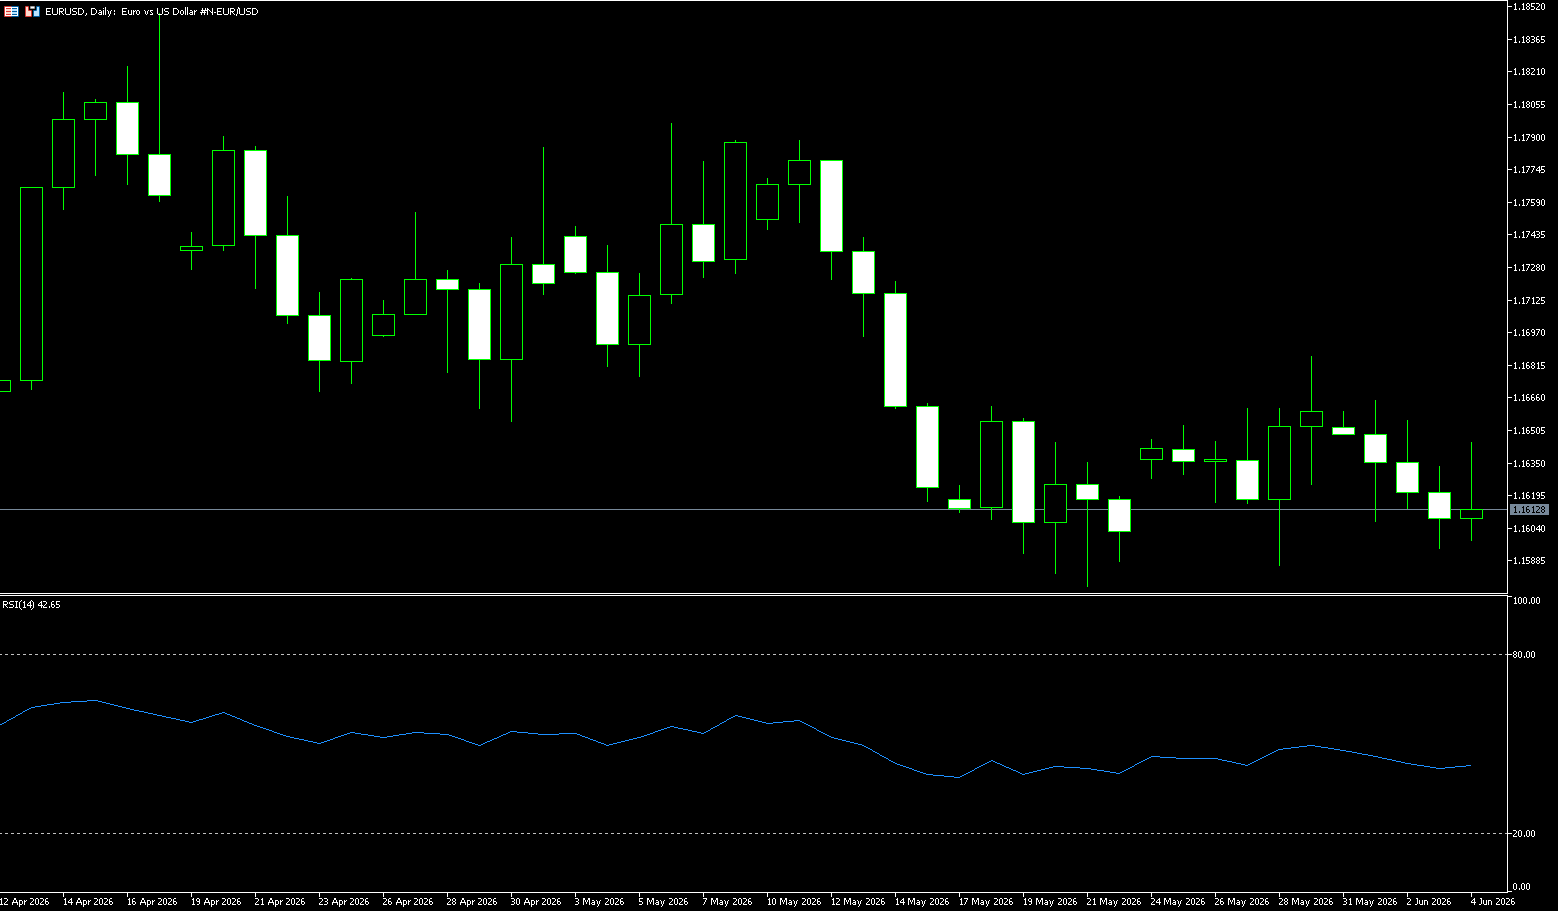
EUR/USD
The euro remained stable around $1.1620 as investors weighed mixed signals from the Middle East conflict and prepared for next week’s European Central Bank meeting. Iran said it had struck a US command ship in the Gulf of Oman, while the Republican-controlled House of Representatives voted to end US military action against Iran, a move that posed a rare challenge to President Trump’s administration. Israel and Lebanon also reached a conditional ceasefire, although Prime Minister Netanyahu warned of possible further strikes. On monetary policy front, the market currently anticipates a near-certain 25 basis point rate hike by the European Central Bank at its June 11 meeting, with expectations of two or three further hikes this year. This comes after data showed Eurozone inflation rose to 3.2% in May, the highest level in two and a half years, primarily driven by soaring war-related energy costs. Core inflation also accelerated to 2.5%, with services inflation rising to 3.5%, indicating that price pressures have extended beyond the energy sector.
From a technical perspective, the EUR/USD exchange rate is holding above the 23.6% Fibonacci retracement level of the April-May decline. Furthermore, the Relative Strength Index (RSI) is around 42, and the Moving Average Convergence Divergence (MACD) is slightly positive, suggesting improved momentum. This, in turn, supports further intraday appreciation, although hawkish bets from the Federal Reserve may limit dollar losses and suppress spot prices. Therefore, any subsequent gains are more likely to encounter immediate resistance near the 38.2% Fibonacci retracement level, around the 1.1675-1.1680 area. Next, the 1.1700 level is a key confluence point. A break above this level could see the EUR/USD pair target the 61.8% Fibonacci retracement level around 1.1740 and the 78.6% Fibonacci retracement level around 1.1785. On the downside, immediate support lies at the psychological level of 1.1600, with deeper support at the lower Bollinger Band around 1.1544. A break below this level would trigger a broader bearish phase.
Today, consider going long on the Euro at 1.1600, with a stop-loss at 1.1585 and targets at 1.1640 and 1.1650.
Stock Analysis:
Australian ASX 200 Stock Index
Basic Market Overview:
The Australian Securities Exchange (ASX) 200 index fell 100 points, or 1.1%, to close at 8,686 on Thursday, paring gains from the previous session and retreating from a one-month high due to profit-taking. Meanwhile, geopolitical tensions in the Middle East resurfaced, with Tehran attacking a Kuwaiti airport and US forces striking targets near the Strait of Hormuz. Locally, the Reserve Bank of Australia warned that first-quarter GDP growth slowed sharply as headline inflation remained at 4.2% in April, above its 2-3% range. However, April trade data showed Australia returned to a surplus, mainly driven by a rebound in exports and weak imports, mitigating losses. Business services, non-energy minerals, and manufacturing contributed to the losses.
BHP Billiton and Rio Tinto fell 3.2% and 3.7% respectively, reaching their lowest points since mid-May, after hitting record highs the previous day. Technology stocks followed the Nasdaq’s weakness, with WiseTech falling 5% and Xero dropping 3%. However, energy stocks bucked the trend, driven by rising oil prices, which boosted Woodside Energy by 0.3% and Santos by 0.8%.
Sector Performance:
Leading Gains:
1. Information Technology (XIJ) | Weekly +4.85% [Strongest Sector of the Week]
Driven by: Strong US tech stocks, improved order expectations for Australian SaaS companies, and capital rotation into growth stocks for safe-haven investment.
Sub-sectors: Cloud software, business travel SaaS, and medical software all performed strongly.
2. Energy (XEJ) | Weekly +2.12%
Driven by: Middle East geopolitical disturbances driving up oil prices, a strong week for uranium mining, and a surge in nuclear power stocks; a large increase at the beginning of the week, followed by slight profit-taking on Thursday.
Sub-sectors: Uranium > Coal > Oil & Gas Refining
3. Raw Materials (XMJ) | Weekly +1.68%
Driven by: Lower-than-expected Australian GDP on Wednesday, rising expectations of interest rate cuts + rising copper and iron ore prices, with BHP and RIO hitting record highs; a pullback in non-ferrous metals and gold on Thursday, dragging down the sector along with other commodities.
Sub-sectors: Copper > Nickel > Coal and gold mining stocks surged and then retreated during the week.
4. Consumer Staples (XSJ) | Weekly +0.72%
Driven by: Safe-haven funds allocating to defensive sectors; a single-day surge in TWE, a leading wine company, boosted the sector.
Lagging Sectors:
1. Communication Services (XTJ, Weekly -1.75%, weakest of the week)
Drag: Classifieds advertising stocks REA, Seek, and automotive e-commerce Carsales continued to weaken; weak consumer spending suppressed valuations.
2. Consumer Discretionary (XDJ, Weekly -1.12%)
Logic: High mortgage rates and high oil prices squeezed consumer discretionary spending; retail, home furnishing, and gaming stocks generally retreated.
3. Utilities (XUJ, Weekly -0.78%)
Characteristics: Interest rate sensitive defensive sector; funds cashed out before the interest rate cut was implemented; electricity and water utilities were under pressure.
Outstanding Stocks:
TWE Treasury Wine Estates | Weekly +14.2%, closing price AUD 4.66, driven by better-than-expected sales of new products in North America and inventory reduction, surging 13% on Thursday, boosting the consumer sector.
PDN Paladin Energy (Uranium Mining) | Weekly +12.7%, closing price AUD 10.87, driven by favorable global nuclear power policies and rising uranium prices; reached a high of +11.5% mid-week, with a slight pullback on Thursday.
SDR SiteMinder (Business Travel SaaS) | Weekly +11.1%, AUD 3.88, driven by a global hotel booking recovery and institutions raising their target price, surging 10.9% on Monday.
Technical Analysis:
The ASX200 index traded between 8625.8 and 8810.5 this week, exhibiting an overall consolidation pattern of initial upward movement followed by a pullback on Thursday with increased volume. Overnight, commodities across the board retreated, with iron ore slightly weakening. Resources and financial sectors collectively plunged, and the index opened high but closed low with increased volume, falling 99.6 points in a single day, erasing most of the week’s gains and breaking through the 50-day moving average support. The overall trend for the week turned from strong to weak. The RSI (14) technical indicator is at 52.34; it has fallen from the overbought range of 61 at the beginning of the week to the neutral range. The bullish momentum has rapidly weakened and has not yet entered the oversold range, so there is still a possibility of further downward fluctuation in the short term. As for the MACD: the red bars continue to shorten, and the DIFF turns downward and approaches the DEA; the MACD bullish structure is on the verge of a death cross. Once the death cross is confirmed, the short-term will enter a period of adjustment; the weekly MACD still maintains red bars, and the medium-term trend has not yet turned bearish. Market breadth: Only 49% of stocks are above their 50-day moving average, and 38% are above their 200-day moving average; market divergence is severe, with only technology and some liquor stocks showing strength (TWE surged 13% this week), while resource and financial stocks dragged down the overall market, and the inflated index performance has faded.
Trading Strategies:
Long Strategy:
Buy in batches on pullbacks to the 8650-8680 range; add to long positions on a pullback to 8800 after a breakout above 8830.
Profit Take: ① Reduce position by 50% at 8880; ② Take full profit at 8920-8930.
Stop Loss: Exit unconditionally if the price falls below 8590 (single trade loss ≤ 2% of total capital).
Short Strategy:
Try shorting again if the price rallies to 8900-8930 and encounters resistance with a long upper shadow.
Profit Take: Take profit in stages from 8800 to 8700.
Stop Loss: Exit at 8960.
Key Risk Warnings:
The marginal easing of the Middle East conflict and the decline in oil prices have eased inflationary pressures in Australia, leading to a slight increase in risk appetite.
New Zealand 50 Index (NZX50)
Basic Market Overview:
The NZX50 index fell 13 points, or 0.1%, to close at 13,102 on Thursday, extending losses from the previous session and hitting its lowest level since May 25, mainly dragged down by consumer goods, financials, real estate, and communication services. The broader index followed suit in subdued trading on Wall Street overnight due to escalating conflict in the Middle East. Traders assessed the possibility of New Zealand facing a new 12.5% tariff from the US after the US Trade Representative stated that 54 economies, including New Zealand, had failed to effectively ban goods produced with forced labor. Wednesday’s economic data also continued to weigh on market sentiment, as New Zealand’s terms of trade for goods in the first quarter of 2026 fell more than expected.
Sector Performance:
Leading Gains:
1. Utilities/Electricity (Strongest Performer This Week)
Meridian Energy and Contact Energy, the two leading companies, steadily rose, benefiting from rising global energy prices and robust local electricity demand; the sector averaged +1.2% to 1.8% for the week.
2. Consumer Discretionary Goods (Optional Consumption)
Retail and Automotive Services led the gains: Briscoe Group, Skellerup, and Turners saw significant increases in automotive stocks during the week, reflecting a rebound in consumer confidence; the sector’s weekly gain was +1.0% to 1.5%.
3. Energy Sector
Rising international crude oil prices boosted local oil and gas companies, with weekly gains ranging from +0.7% to 1.1%.
4. Industrials/Logistics Infrastructure
Mainfreight, Freightways, and Fletcher Construction saw volatile gains, supported by strong export data; weekly gains ranged from +0.6% to 1.0%.
Leading Declines: 1. Telecommunications (Weekly Leading Decline)
Chorus continued its weakness, with interest rate hike expectations suppressing the valuations of high-dividend utilities and telecommunications. The sector fell -1.3%~-1.9% this week, making it the weakest sector in the entire market.
2. Healthcare
Fisher & Paykel Healthcare and AFT Pharmaceuticals fluctuated downwards, dragged down by profit-taking and downward revisions in earnings forecasts by Australian pharmaceutical companies; the sector fell -0.8%~-1.2% this week.
3. Raw Materials/Basic Materials
Steel and building materials raw materials were dragged down by the global commodity price correction. Wolferm Steel and Fletcher experienced a temporary pullback; the sector fell -0.6%~-1.0% this week.
4. Consumer Staples (Mainly Dairy)
A2 Milk and Ebos Group were relatively weak, with rising food inflation suppressing end-market profit expectations, resulting in a slight decline of -0.4%~-0.7%.
Technical Analysis:
Overall characteristics of this week: A post-holiday gap-up followed by a decline and weakening trend. Pressured by expectations of a Reserve Bank of New Zealand rate hike and geopolitical tensions in the Middle East, short-term bears are in control, and the week is highly likely to close lower (a bearish signal). The NZX50 index has broken below all moving averages (5/50/200 days), with the 5-day moving average (13210) crossing below the 10/20-day moving averages to form a death cross. Short- and medium-term moving averages are in a bearish alignment, and prices are continuously suppressed by these moving averages. Rebounds are merely technical corrections and unlikely to sustain upward momentum. The 14-day Relative Strength Index (RSI) is in the 41.6-43.6 range; the indicator has fallen below the 50 level, the key indicator for determining strength or weakness, but has not yet entered oversold territory (below 30), indicating that bearish momentum is still being released. There is no clear bottoming signal in the short term; only a return of the RSI above 50 will reverse the weakness. MACD: The MACD lines are running below the zero line in negative territory with a bearish crossover, indicating continued downtrend momentum. There are currently no signs of a golden cross reversal, and the medium-term downtrend structure remains intact.
Trading Strategy (Primarily Short-Term)
Long Position Conditions: A strong break above 13230 (200-day moving average) with increased volume + RSI above 50. Buy on a pullback to 13180, with a target of 13300. Do not actively buy before a strong break above this level.
Short Position Conditions: A decisive break below 13128 (this week’s low) indicates a bearish trend. The first target is 13005, with further short positions added if it breaks down to 12830. Short positions can be initiated on a rebound to 13200 if resistance is encountered.
Risk Warning:
Rising oil prices are fueling global inflation concerns, suppressing global risk appetite. Foreign capital continues to flow out of the New Zealand stock market in small amounts, with a net outflow of over NZ$1.4 billion since May. Insufficient new funds in the market are hindering any rebound. The above is for technical analysis only and does not constitute any investment or trading advice. The stock market is highly susceptible to geopolitical events and sudden changes in central bank policies.
Disclaimer: The information contained herein (1) is proprietary to BCR and/or its content providers; (2) may not be copied or distributed; (3) is not warranted to be accurate, complete or timely; and, (4) does not constitute advice or a recommendation by BCR or its content providers in respect of the investment in financial instruments. Neither BCR or its content providers are responsible for any damages or losses arising from any use of this information. Past performance is no guarantee of future results.

Comments
No comments yet. Be the first to share your thoughts!
Authentication Required
You must be logged in to post a comment.