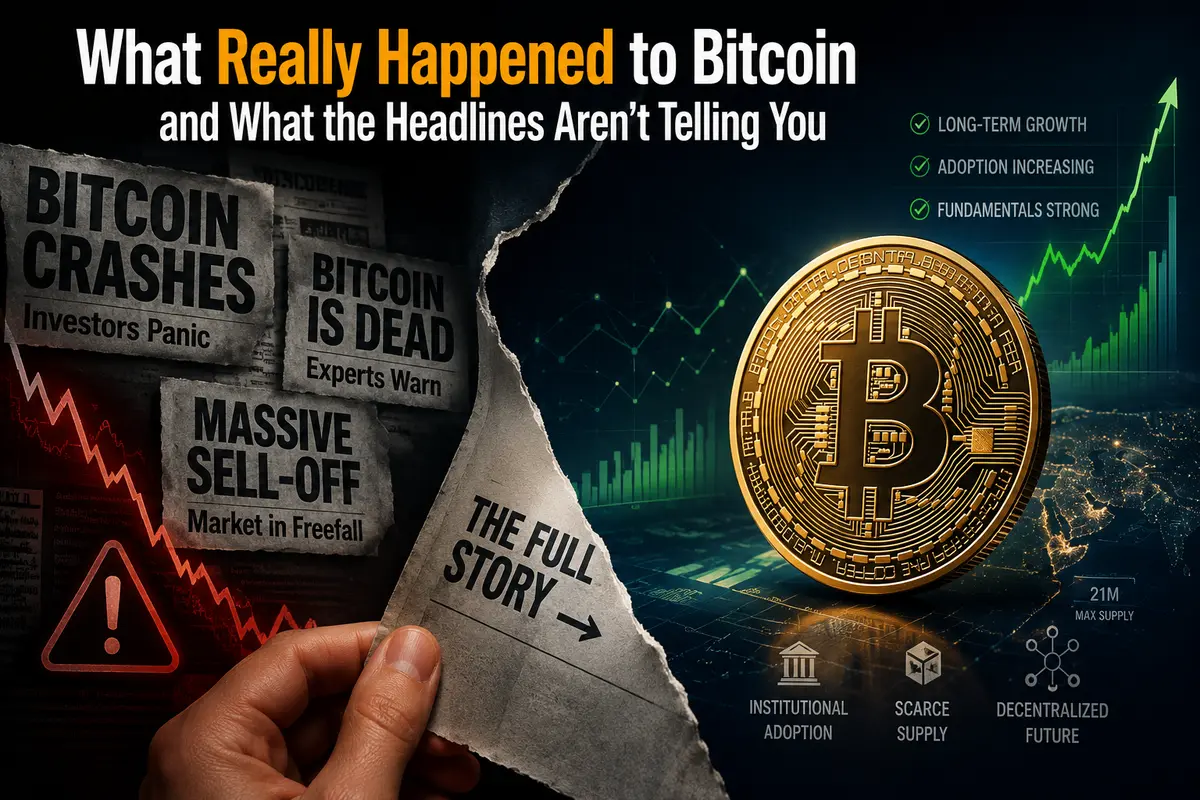
What Really Happened to Bitcoin and What the Headlines Aren’t Telling You
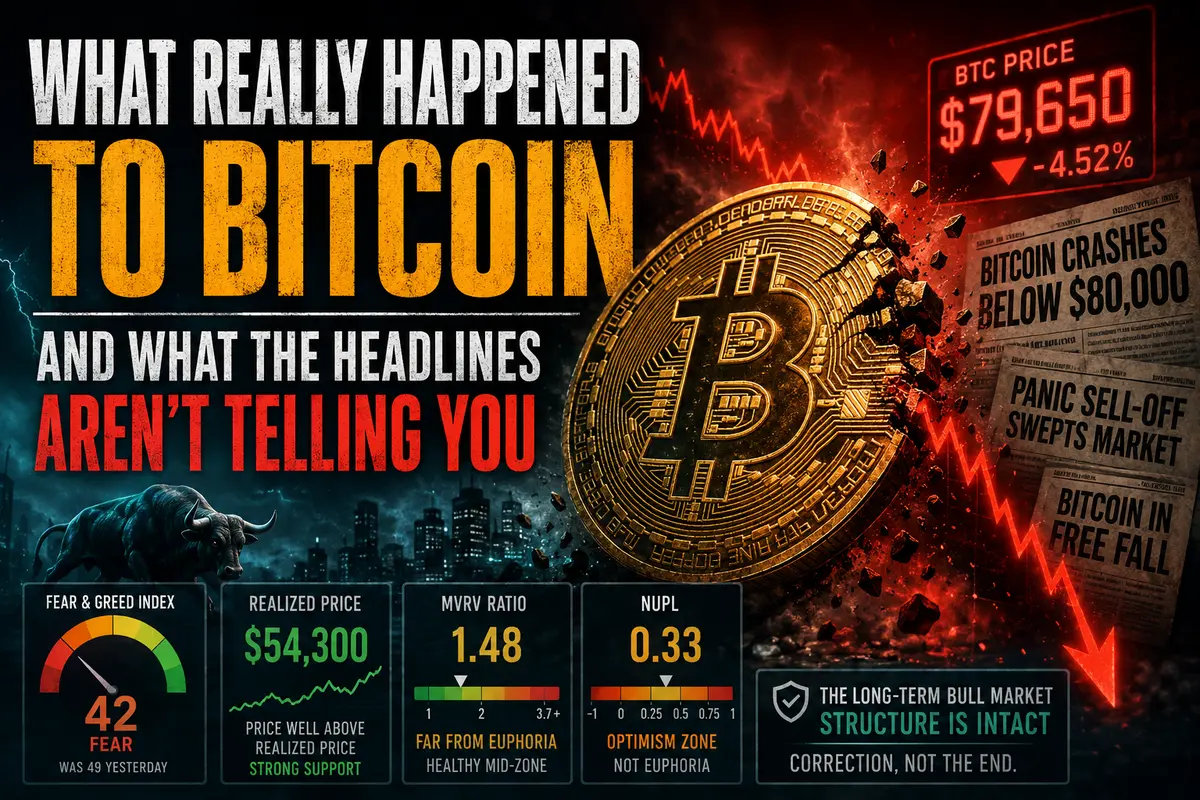
Bitcoin has once again dipped below the level that many had already started to treat as a new floor. Eighty thousand dollars — a psychological threshold beyond which either panic or calm accumulation begins, depending on who’s looking at the chart. And that threshold just gave way. Over the past 24 hours, the leading cryptocurrency slid to $79,650, and a wave of forced liquidations swept across the market — the kind that always accompanies sharp moves.
But the headlines screaming about a crash are telling only half the story. They capture the fear while missing the curious picture that emerges when you look under the hood of the blockchain. And there, beneath the layer of momentary emotions and liquidation cascades, the numbers paint a far more nuanced picture. Yes, the market is getting shaken. Yes, sellers are applying pressure. But the long-term bull market structure hasn’t gone anywhere — it has simply taken a breather, and the data backs that up.
A Bloodbath in the Derivatives Market
What happens when the price takes a sudden dive? A familiar mechanic kicks in — one the crypto market knows all too well. Traders who opened leveraged long positions get caught off guard. The exchange forcibly closes their positions to avoid taking a loss, and those liquidations themselves become fuel for further declines. A snowball rolling downhill, growing as it goes.
Over the past 24 hours, positions totaling nearly 142.6 million came from longs, while barely $15.9 million came from those betting on a decline. Nearly 90% of all liquidations were buyers who believed the uptrend would continue and didn’t manage to jump out in time. This is a classic picture of a sudden panic sell-off: the market catches the crowd leaning in one direction, then sharply reverses, shaking out everyone standing on the wrong side.
When this happens, the crypto community usually starts glancing at sentiment indicators. And they, predictably, have turned a worried shade.
The Fear and Greed Index Gets Dunked in Cold Water Again
There’s a simple yet surprisingly accurate barometer of market emotions — the Fear and Greed Index. It doesn’t predict the future, but it does a brilliant job of showing the present: what is happening right now inside the heads of market participants. And this index has tumbled to 42, crossing from neutral territory straight into fear.
Just a day earlier, it was holding at 49 — neither here nor there, a neutral zone where everyone is more or less indifferent. And a month ago, we even saw a reading of 21, marking a phase of extreme fear, when people literally flinch at their own shadows and are afraid to press the buy button. The current 42 isn’t outright panic, but the market is clearly on edge. Buyers haven’t vanished; they’ve simply taken a couple of steps back and are waiting to see how this plays out.
But here’s what’s curious: emotions are emotions, but the blockchain data tells a completely different story. If you tear yourself away from the minute-by-minute charts and look at the fundamental metrics, you can see that the market’s long-term structure is holding up surprisingly well.
Realized Price: The Anchor Holding the Market in Place
Bitcoin has one wonderful metric that can’t be faked and is very hard to ignore. It’s called the realized price, and it reflects the average cost basis of all investors in the market. Roughly speaking, it’s the price at which people on average bought their bitcoin. And that metric currently sits around $54,300.
Why does this matter so much? Because the current price, despite the entire drop, is bobbing well above that level. Selling below the realized price would mean that the market on average has slipped into a loss, and that’s when a truly serious capitulation would begin. But that hasn’t happened yet. For now, the market as a whole is still in a profit-taking phase — people are selling at higher prices than they bought, they’re just doing it nervously and chaotically.
Moreover, the realized price of long-term holders forms a powerful support zone beneath the market. This is the level at which, in past cycles, declines have stopped and reversals have begun. When the price approaches the average cost basis of those who have held the asset for years, sellers dry up — who wants to sell at break-even or a loss after so many years of waiting?
MVRV: The Market Is Far from Euphoria
Another key metric is the MVRV ratio, which compares bitcoin’s market value to that same realized price. Right now, it stands at 1.48. What does this tell us? That the market is valued at roughly one and a half times what people on average paid for it. Not low, but not catastrophically high either.
To understand the scale, you need to look at history. In previous cycles, readings above 3.7 indicated that the market was overheated and a bubble was about to burst. A drop below 1, on the other hand, coincided with macroeconomic bottoms, when bitcoin was genuinely undervalued. The current reading of 1.48 is a calm middle ground. No euphoria, no frenzied overheating. A market that is simply working, without hysteria in either direction.
This is a fundamentally important point for understanding the current situation. The drop below eighty thousand didn’t happen because bitcoin was monstrously overbought and inflated like a balloon. Nor because the fundamental market structure had broken. Short-term mechanics simply kicked in: leverage, stop-losses, cascading liquidations. The long-term foundation, meanwhile, remained untouched.
NUPL: Profit Exists, but Without Madness
There’s another metric that illuminates the same picture from a slightly different angle. The Net Unrealized Profit/Loss ratio, or NUPL, currently sits at 0.33. This means that a third of bitcoin’s market capitalization is pure unrealized profit for investors. People are in the green, but not the kind that makes your head spin and triggers an overwhelming urge to sell everything and lock in a record.
Historically, this metric breaks down into several phases. Negative readings mean capitulation — everyone is in the red, and nobody wants to trade. From zero to 0.25 is the hope phase, where the market is just beginning to recover. From 0.25 to 0.5 is the optimism zone, which is exactly where we are right now. From 0.5 to 0.75 is belief, where the market starts gaining real momentum. And above 0.75 is euphoria, when everyone around you is talking about nothing but crypto and your taxi driver is telling you to buy bitcoin.
The current reading of 0.33 is optimism, but of the very restrained kind. There’s still a long way to go before euphoria. And that, paradoxically, is good news against the backdrop of a sell-off. The market isn’t crashing down from the height of insane expectations. It’s correcting from perfectly reasonable levels, where there isn’t yet an overhang of panic sellers who bought at the peak of frenzy.
What to Make of All This
Blockchain data, unlike financial news headlines, doesn’t scream and doesn’t panic. It simply records facts. And the facts are these: short-term speculators have taken a painful hit, the derivatives market has suffered a micro-crisis, and the Fear and Greed Index has slipped into caution territory. But the realized price is holding, MVRV is nowhere near bubble levels, NUPL is signaling restrained optimism, and the long-term bull market structure hasn’t broken.
This doesn’t mean bitcoin won’t fall further tomorrow. It might. The market is capable of any kind of acrobatics, and short-term movements are unpredictable by definition. But if you look not at hours and days, but at months and quarters, the blockchain metrics show that the current decline is, for now, a correction within a broader uptrend. Not the end of the world, not the death of the crypto market, but just another episode in its never-ending drama between greed and fear.
When the Fear and Greed Index drops below 45, when liquidations wipe out 90% of longs, when headlines are sowing panic — it’s precisely in moments like these that long-term investors usually start eyeing purchases. Not because they’re smarter than everyone else. But because they’re looking not at headlines, but at data. And the data, for now, says the bull market is still alive. It’s just taking a short breather.

Comments
No comments yet. Be the first to share your thoughts!
Comments only for logged-in users.