

NZD/USD (The Kiwi) – Dairy Prices, Carry Trades, and High-Beta Spills
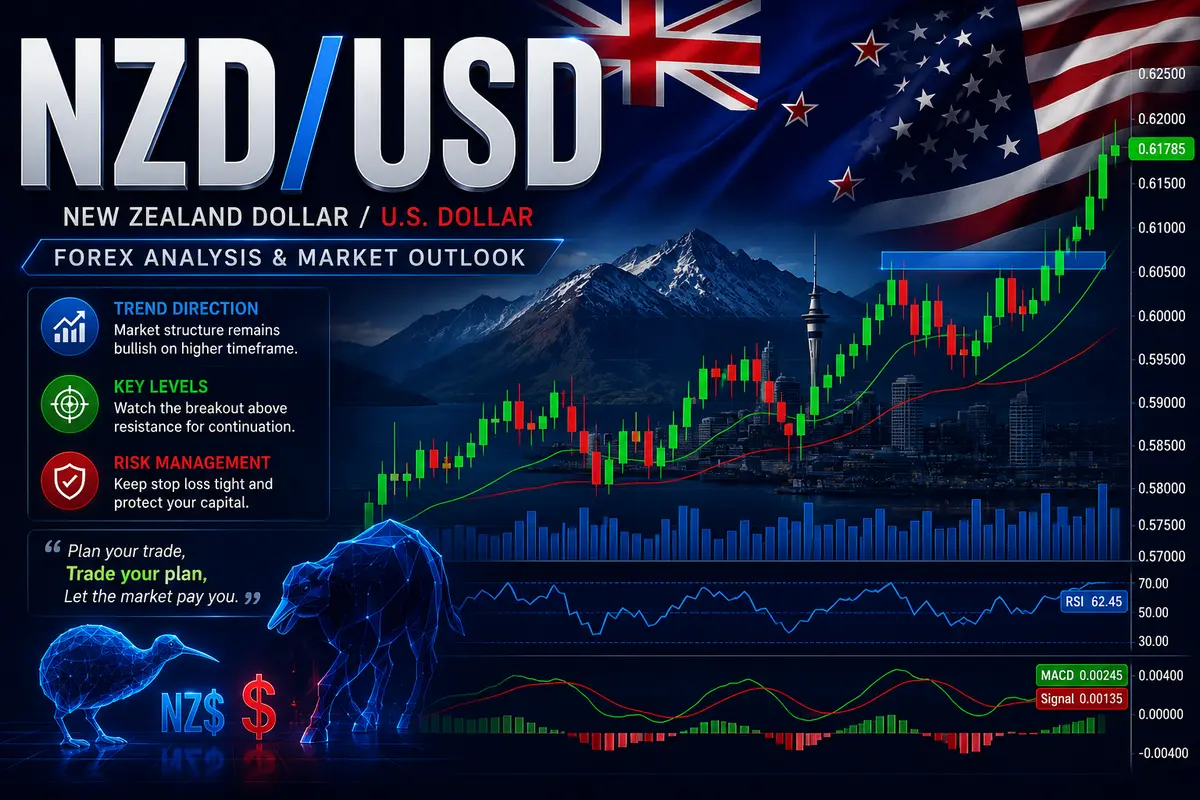
Trading NZD/USD—affectionately dubbed “The Kiwi” on dealing desks—is like trading AUD/USD’s smaller, more reactive sibling. New Zealand might be a small island nation in the South Pacific, but its currency punches way above its weight class in global forex volume.
If you try to trade NZD/USD using generic technical patterns without understanding how dairy auctions, global interest rate differentials, and illiquid Asian sessions move it, you’re essentially flipping coins.
The Milk Factor: Why Whole Milk Powder Rules the Charts
Here is something traditional retail indicators will never show you: the economic health of New Zealand is heavily glued to agricultural exports, specifically dairy.
Fonterra, a massive New Zealand multinational dairy co-operative, controls a huge chunk of the global dairy trade. Twice a month, the Global Dairy Trade (GDT) auction takes place.
When whole milk powder prices surge at the GDT auction, capital surges into the Kiwi. When dairy prices slump, the Reserve Bank of New Zealand (RBNZ) gets dovish, and NZD/USD bleeds out.
If you wake up on a Tuesday morning and see NZD/USD moving agressively with no obvious news on the standard forex calendars, check the GDT auction results. Nine times out of ten, that’s where the volume came from.
The Carry Trade Mechanics (And Why They Sudden Break)
For years, the Kiwi was a favorite playground for the “carry trade.”
Because the RBNZ historically kept interest rates higher than many other developed nations, big institutional funds loved borrowing cheap money in low-interest currencies (like the Japanese Yen) and dumping it into high-yielding New Zealand Dollar assets.
This creates long, smooth upward trends during quiet, low-volatility macro environments.
The danger comes when global market volatility spikes. The second a banking panic or market crash hits, carry traders rush to close their positions all at once. They sell off their Kiwi assets to buy back the currency they borrowed. This causes NZD/USD to crash hard and fast, easily smashing through technical support levels like they aren’t even there.
Navigating the Low-Liquidity Traps
Because New Zealand is one of the first major financial markets to open its doors every day, the early Asian session gets unique price action on NZD/USD.
-
The Early Asian Trap: Between 17:00 and 20:00 EST, liquidity on NZD/USD is paper-thin. Spread sizes temporarily widen, and minor orders can move price erratically. Avoid taking breakout trades during these off-hours.
-
The RBNZ Shockwaves: The RBNZ isn’t afraid to surprise markets. They frequently drop bold, decisive rate decisions or forward-guidance statements that trigger 80-pip spikes in seconds.
-
The Aussie Lead: Keep an eye on AUD/USD. Australia and New Zealand share a close economic footprint. If AUD/USD starts dumping on heavy volume, NZD/USD will almost always follow shorty after. If NZD/USD lags behind, that gap usually closes fast.
The Cross-Rate Pressure Valve: NZD/JPY and AUD/NZD Dynamics
To really get how NZD/USD behaves on your screen, you have to look past the direct spot pair and look at what’s happening in the cross-currency world. Institutional desks rarely just trade NZD/USD in isolation; they use cross-rates to hedge, park cash, or exploit yield gaps.
1. The AUD/NZD Relative Strength Divergence
Australia and New Zealand are neighbors, but their central banks don’t always dance to the same beat. When the Reserve Bank of Australia (RBA) turns hawkish while the Reserve Bank of New Zealand (RBNZ) starts waffling, big money dumps the Kiwi and buys the Aussie.
This shows up immediately on the AUD/NZD chart. If AUD/NZD is aggressively breaking out to the upside, it acts like a anchor dragging NZD/USD down, even if the US Dollar itself isn’t particularly strong that day. If you see NZD/USD lagging behind a global US Dollar sell-off, check AUD/NZD—it usually means institutional money is actively fleeing Wellington for Sydney.
2. The NZD/JPY Risk Engine
When global markets are flying high and risk appetite is hot, funds love pairing the Kiwi against the low-yielding Japanese Yen. When NZD/JPY is trending up smoothly on a daily timeframe, it signals that global investors are happy taking on risk.
This macro tailwind feeds directly back into NZD/USD, creating higher lows and shallow, predictable pullbacks. But the second NZD/JPY turns ugly and breaks key daily support, expect NZD/USD to drop like a rock.
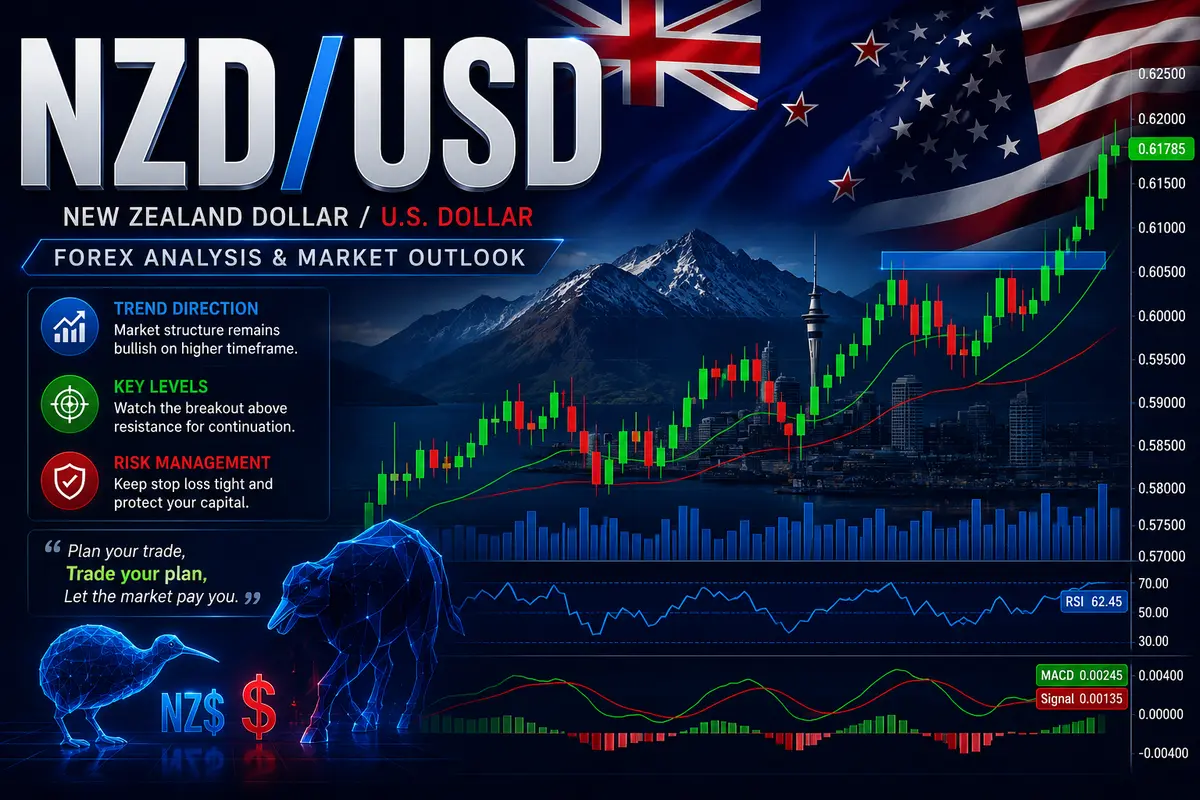
Understanding the RBNZ Strategy: Why They Love a Weak Kiwi
Central bank communications are full of code, but the RBNZ is often surprisingly blunt about its currency preferences.
New Zealand relies heavily on exports to power its economy. If the Kiwi dollar gets too expensive, New Zealand milk, meat, and wine become less competitive on the global market. That hurts local farmers and drags down overall economic growth.
Because of this, whenever NZD/USD rallies too hard toward multi-month highs without strong economic data backing it up, expect RBNZ officials to throw cold water on the market. They will drop dovish comments during media appearances, express concern over “unjustified exchange rate strength,” or explicitly hint at rate cuts.
When an RBNZ official opens their mouth to complain about a strong currency, don’t try to buy the dip. Let the market slide, wait for the emotional selling to clear out retail stop losses, and only look for trades once price settles into a major daily demand block.
Session-by-Session Breakdown for Active Execution
If you’re sitting in front of the charts every day, you need a game plan for how NZD/USD moves from the moment the sun comes up in Wellington to the close of business in New York.
-
Wellington / Sydney Session (18:00 – 00:00 EST):
-
This is local territory. High-impact domestic news, trade balance data, and RBNZ announcements drop right in this window.
-
Volatility can be erratic here because global volume is still ramping up. Unless there is a direct news catalyst, treat moves in this window as structure-building rather than long-term trend launches.
-
-
Tokyo / Asian Continuation (00:00 – 02:00 EST):
-
Asian markets process the early Wellington data. If China drops economic prints during this time, NZD/USD will react immediately.
-
Pay close attention to how price behaves near the high and low of the initial Wellington range.
-
-
London Session Open (02:00 – 06:00 EST):
-
European banks bring real liquidity to the table. They love running price past the Asian high or low to sweep built-up stops.
-
Look for liquidity sweeps here. If price sweeps the Asian low during the early London open and aggressively reclaims the range, you often get a clean long setup heading into the US session.
-
-
New York Overlap (08:00 – 12:00 EST):
-
US economic data (CPI, NFP, Retail Sales) takes over the driver’s seat.
-
The US Dollar side of the equation dictates direction now. If US data comes in wildly hot, it will override any regional Asian/Pacific narrative and push NZD/USD into a strong directional run to close out the day.
-
Intraday Trade Blueprint
-
Check the Calendar: Mark out bi-weekly GDT auction dates and RBNZ rate statements before placing trades.
-
Watch the Asian Range: Identify the highs and lows built during the Wellington/Sydney trading window (18:00 to 01:00 EST).
-
Wait for London Participation: Don’t get chopped up during thin Asian volume. Let European banks enter the market around 02:00 EST to sweep liquidity above or below the Asian range.
-
Target Clean Liquidity Pools: Because the average daily range on NZD/USD is relatively compact (often 40 to 70 pips), don’t get greedy. Target obvious swing highs, swing lows, or unmitigated 15-minute imbalances, and lock in profits early.

Comments
No comments yet. Be the first to share your thoughts!
Authentication Required
You must be logged in to post a comment.