

Bitcoin Capitulation Deepens Near $64K as Holders Exit: Can BTC Avoid a Deeper Drop?

million,
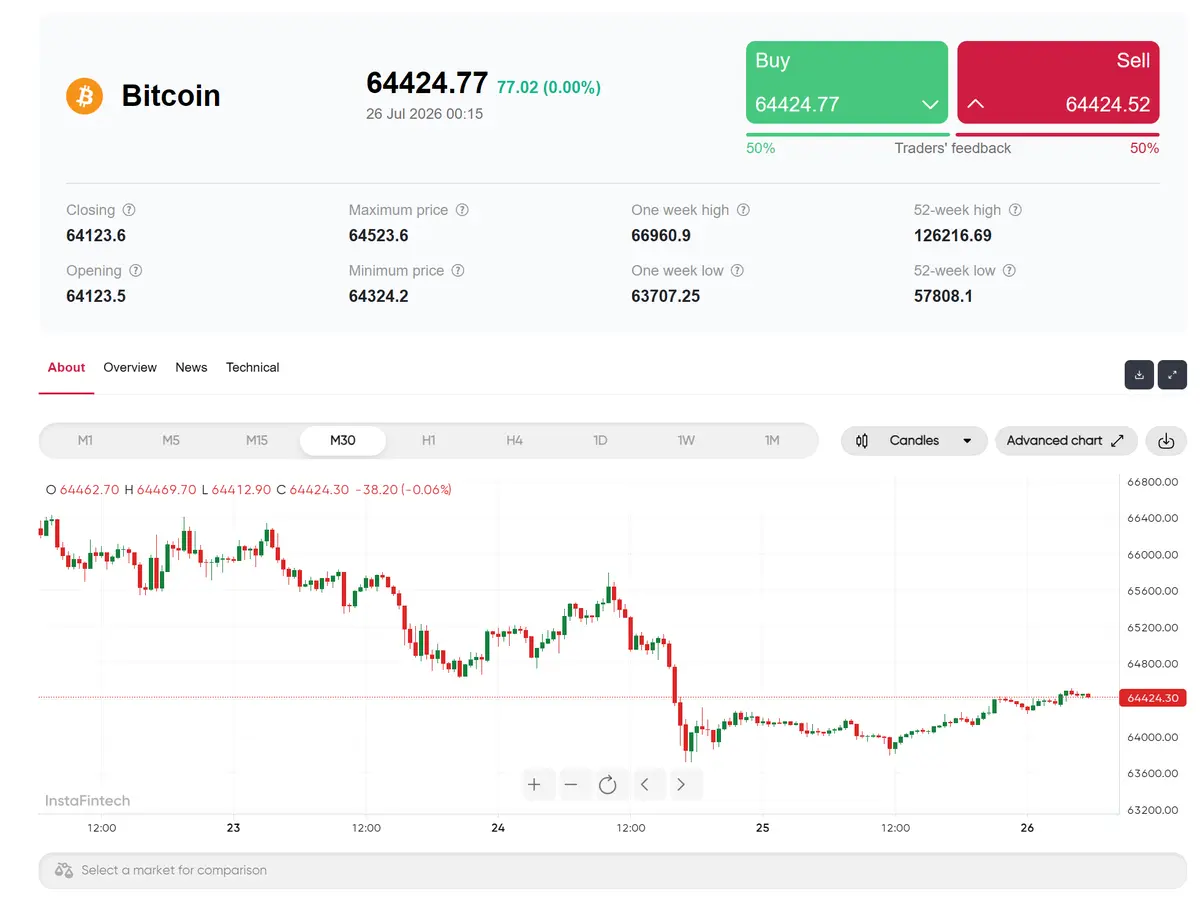
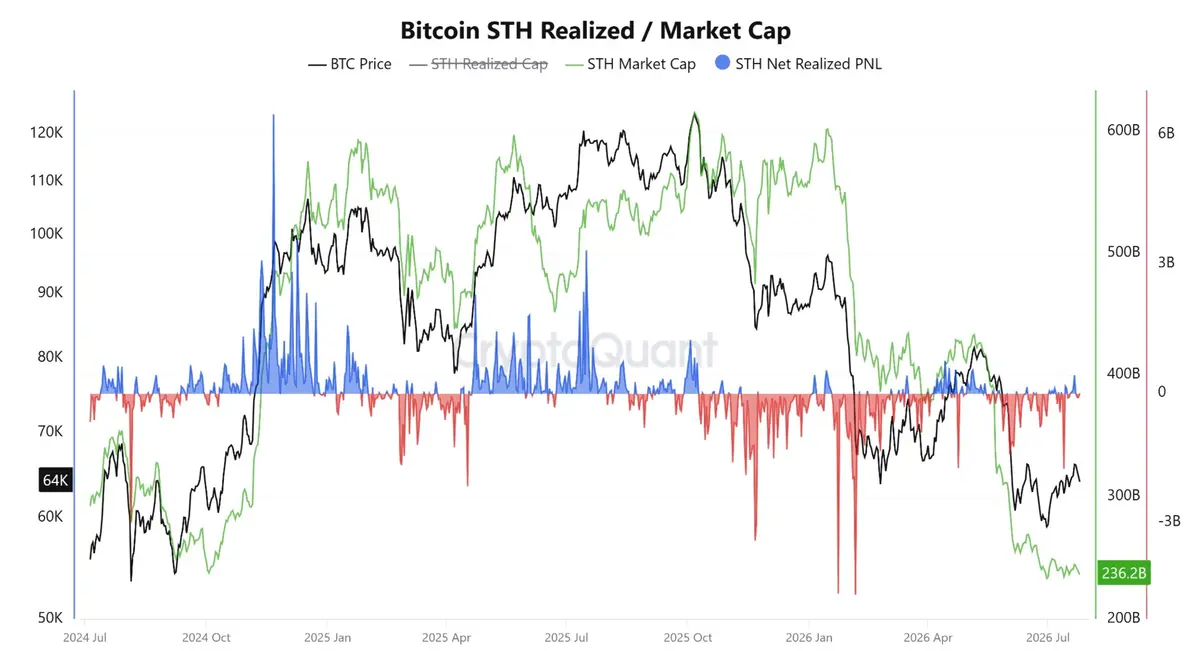
Bitcoin’s BTCUSD ... recent slide toward $64,000 has amplified losses among investors with short-term positions and brought key technical support levels into sharp focus. Data from CryptoQuant indicates that Bitcoin short-term holder market capitalization declined to $236.2 billion, reaching its lowest level since mid-2024 and signaling intensified selling pressure from recent buyers.
Contents
-
Short-term holder losses mount as capitalization nears multi-year low
-
Key technical support: $63,800-$62,400 zone outlines next BTC move
Short-term holder losses mount as capitalization nears multi-year low
CryptoQuant’s on-chain metrics confirm that net realized profit and loss for Bitcoin holders have remained negative in recent weeks. This pattern reflects sustained selling below cost by those who purchased amid recent volatility, coinciding with repeated spikes in realized losses during the ongoing market retreat.
The steep drop in short-term holder capitalization suggests that market participants with positions opened over the last several months are continuing to exit. Despite these outflows, ownership trends after the sell-off remain unclear based on available blockchain data.
At $236.2 billion, the current value controlled by short-term holders is approaching its lowest level in more than a year. This contraction illustrates diminished purchasing enthusiasm among investors who entered the market in 2025 and 2026.
Technical analysts are paying close attention to several chart levels under pressure. Ali Charts highlighted $63,800 as a crucial decision point on the four-hour time frame, identifying it as immediate support and marking $67,000 as a potential upside target if this level holds.
Price action shows short-term holders realizing losses as Bitcoin approaches $64,000, with market attention focused on the $63,800 support. If support is maintained, recovery toward $67,000 is possible, but a break below could expose $60,000 as the next key level.
Should Bitcoin fail to hold the $63,800 mark, the next major technical target sits at $60,000, escalating the risk of a deeper correction.
Key technical support: $63,800-$62,400 zone outlines next BTC move
Further technical analysis reinforces the pivotal role of the current support zone. According to Titan, a widely followed market analyst, Bitcoin closed beneath its daily Tenkan line, a short-term trend indicator used in the Ichimoku Cloud system. This shift directs attention toward the Kijun line at $62,400 as the next logical target.
Mini dictionary: Ichimoku Cloud – A technical analysis system combining several indicators, including the Tenkan (conversion line), Kijun (base line), and Kumo cloud, designed to identify support, resistance, and trend direction in financial markets.
With Bitcoin closing below the Tenkan on the daily chart, the Kijun at $62,400 now becomes the immediate focus for further support. Breaching both $63,800 and $62,400 could accelerate downside volatility and point to the lower boundary of the Kumo cloud.
The combined studies from Ali Charts and Titan define a critical zone between $63,800 and $62,400 for immediate market direction. If Bitcoin closes under this range, the $60,000 chart target comes into play.
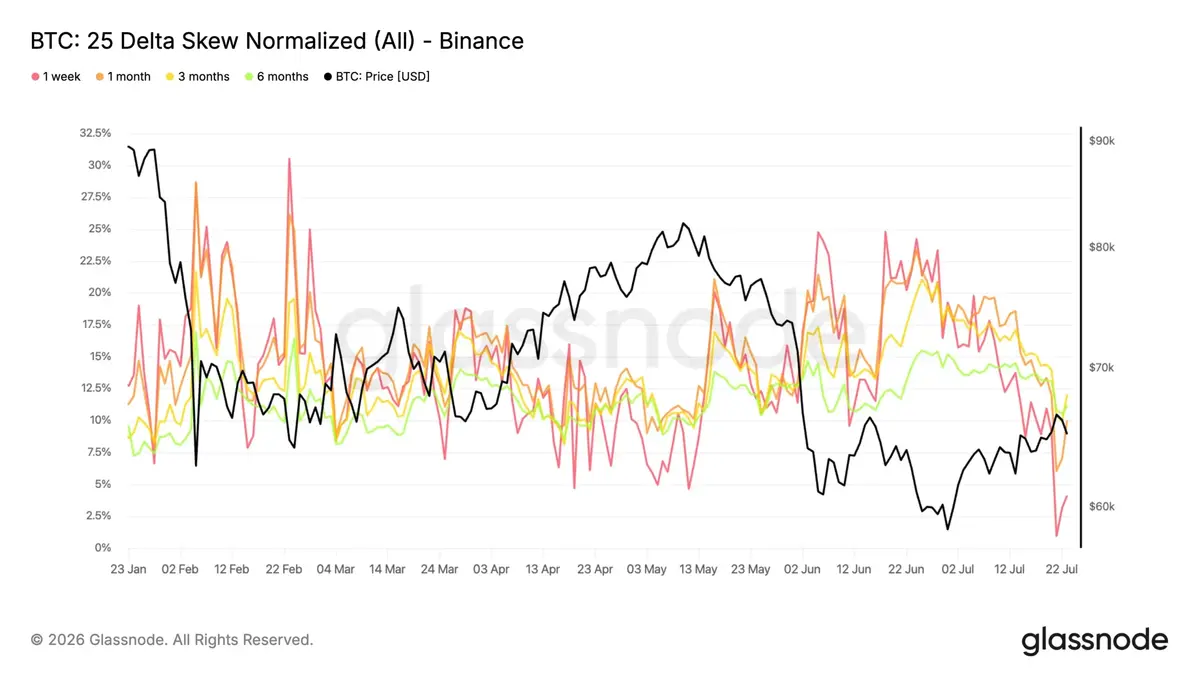
Options market data adds another layer to the risk landscape. Glassnode reported that Bitcoin’s one-week 25-delta skew retreated to approximately 4%, with the three-month and six-month skews holding between 11% and 12%. This disparity indicates short-term downside hedging has lessened, even as longer-term protection remains expensive for traders hedging against further declines later in the year.
MetricCurrent Value Reference Period
Short-term holder capital $236.2 billion Lowest since mid-2024Key support zones $63,800 / $62,400 Immediate
next downside targe $60,000 If supports break
1-week option skew ~4% Recent
3-6 month skew 11%-12% Recent
While lingering losses and support tests define the short-term picture, the ability of Bitcoin to stabilize above $63,800 and $62,400 will dictate whether the current selloff is ending or preparing for further extension. Traders and investors continue to monitor these levels as the most immediate measures of shifting market sentiment.
🆘Clear Pressure on Short-Term Bitcoin Holders (STH)
The market value of STH holdings dropped to $236.2 billion on July 25, marking only the second time it has reached a level below the October 3, 2024 reading—the lowest reading recorded throughout 2024.
And on July 13, realized losses for STH jumped to about $1.75 billion, an increase of nearly $340 million or 24% from the $1.41 billion losses on June 2.
Notably, the pace of realized losses has currently eased, but the market value for the short-term investor category remains at historically low levels.
A decline in STH Market Cap does not necessarily mean an equivalent value is exiting the market; part of it may result from coins shifting from the short-term holder classification to long-term holders, alongside price changes and supply volume within the category.
In summary: new investors have faced strong pressure, while the ongoing contraction of the STH category has become one of the most important on-chain signals worth tracking right now on #Bitcoin.

Comments
No comments yet. Be the first to share your thoughts!
Authentication Required
You must be logged in to post a comment.