

USD/JPY – Yield Differentials, Central Bank Interventions, and Tokyo Asian Ranges
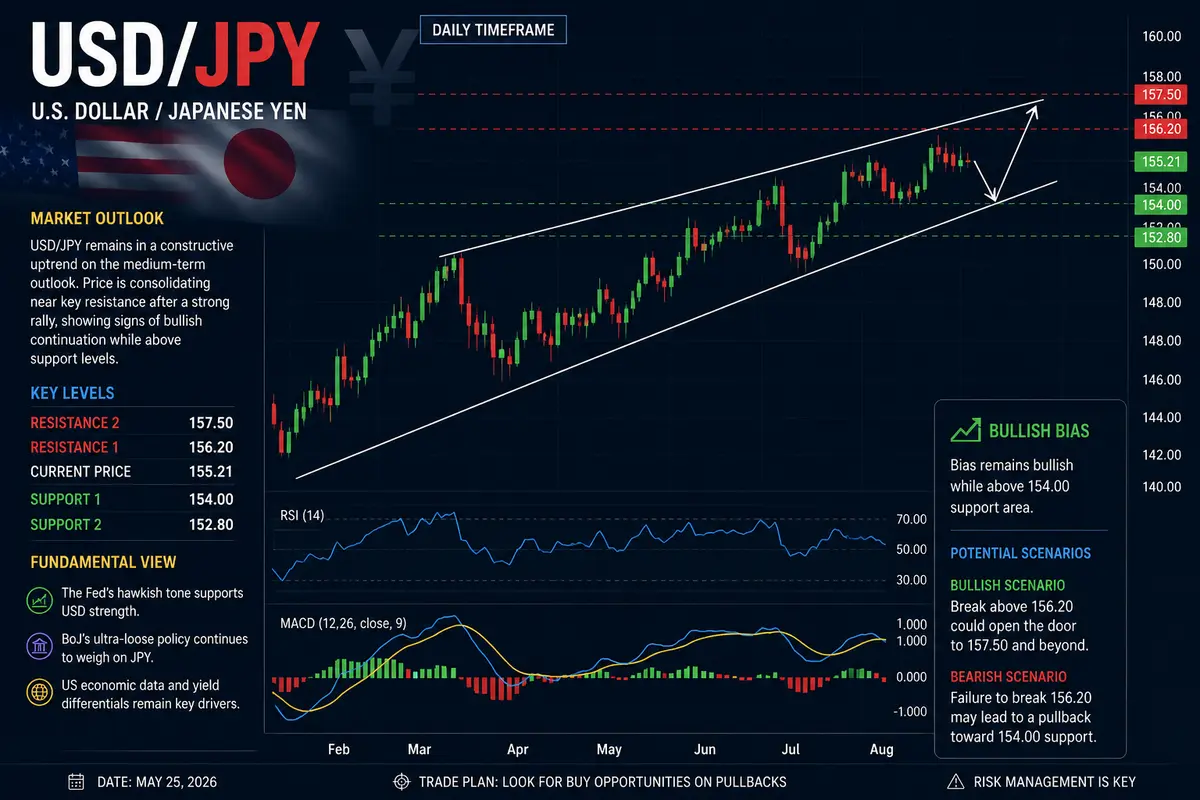
Trading USD/JPY (the Dollar/Yen) requires a fundamental shift in mindset compared to trading European currencies. While pairs like EURUSD ... and GBPUSD ... derive the bulk of their daily volatility from London and New York session openings, USDJPY ... is uniquely positioned as a bridge between Asian institutional liquidity and Western bond market dynamics.
Historically known as one of the cleanest trending assets in the foreign exchange market, USD/JPY can consolidate in tight ranges for days before launching into multi-hundred-pip expansions driven by interest rate expectations, global risk sentiment, and official central bank policy.
The Macro Core: Treasury Yields and Central Bank Policy Divergence
The long-term trend of USD/JPY is rarely determined by chart patterns alone. Instead, it is almost directly tied to the interest rate differential between the United States and Japan, specifically tracked via the US 10-Year Treasury Yield (TNX).
The Mechanics of Yield Divergence
-
The Fed vs. Bank of Japan (BoJ): For decades, the Bank of Japan maintained ultra-low or negative interest rates to combat deflation, while the US Federal Reserve adjusted interest rates to manage domestic growth and inflation.
-
The Yield Correlation: When US 10-Year Treasury yields rise, investors borrow capital in low-yielding Yen to purchase higher-yielding US Dollar assets (the classic “Carry Trade”). This creates massive capital outflows from Japan, driving USD/JPY aggressively higher.
-
Tracking US10Y: If you are trading USD/JPY, keeping a US 10-Year Treasury yield chart open side-by-side is essential. A sharp upward expansion in Treasury yields almost always triggers an immediate bullish push in USD/JPY.
Understanding Bank of Japan Interventions
Because Japan relies heavily on imports for energy and food, an excessively weak Yen increases domestic living costs. When USD/JPY rises too rapidly, the BoJ and Ministry of Finance (MoF) may intervene directly in the foreign exchange market.
-
Intervention Mechanics: Unlike normal market liquidity, an official intervention involves the central bank selling massive reserves of US Dollars to buy Yen.
-
Price Behavior: Interventions trigger violent, unannounced downward spikes—often dropping USD/JPY by 200 to 400 pips in a matter of minutes. Trading during periods of official MoF warning requires strict risk controls and position sizing.
Session Dynamics: Navigating the Tokyo Asian Range
Unlike EUR/USD, where the Asian session is predominantly a low-volume holding pattern, the Asian session (20:00 to 02:00 EST / Tokyo Open) is a prime volatility window for USD/JPY.
1. The Tokyo Fixing (09:55 AM JST / 20:55 EST)
Every morning in Tokyo, Japanese commercial banks, importers, and exporters settle their daily foreign exchange requirements at the official fixing rate set at 09:55 AM JST.
-
Commercial Liquidity: Significant institutional buy or sell flows occur in the 30 minutes leading up to the fix.
-
Trading Implication: Look for quick liquidity runs toward key daily levels right before the 09:55 AM Tokyo fix, followed by stabilization or mean reversion once commercial orders are matched.
2. The London Overlap and New York Acceleration
While Tokyo provides the initial Asian structure, the largest trend expansions on USD/JPY occur during the New York session (08:00 to 11:00 EST).
-
This timing coincides with US economic data releases (CPI, NFP, Retail Sales) and the opening of the US bond market.
-
If Tokyo built a tight consolidation range overnight, the New York open frequently acts as the primary expansion catalyst.
Technical Traits of USD/JPY
Smooth Trend Delivery
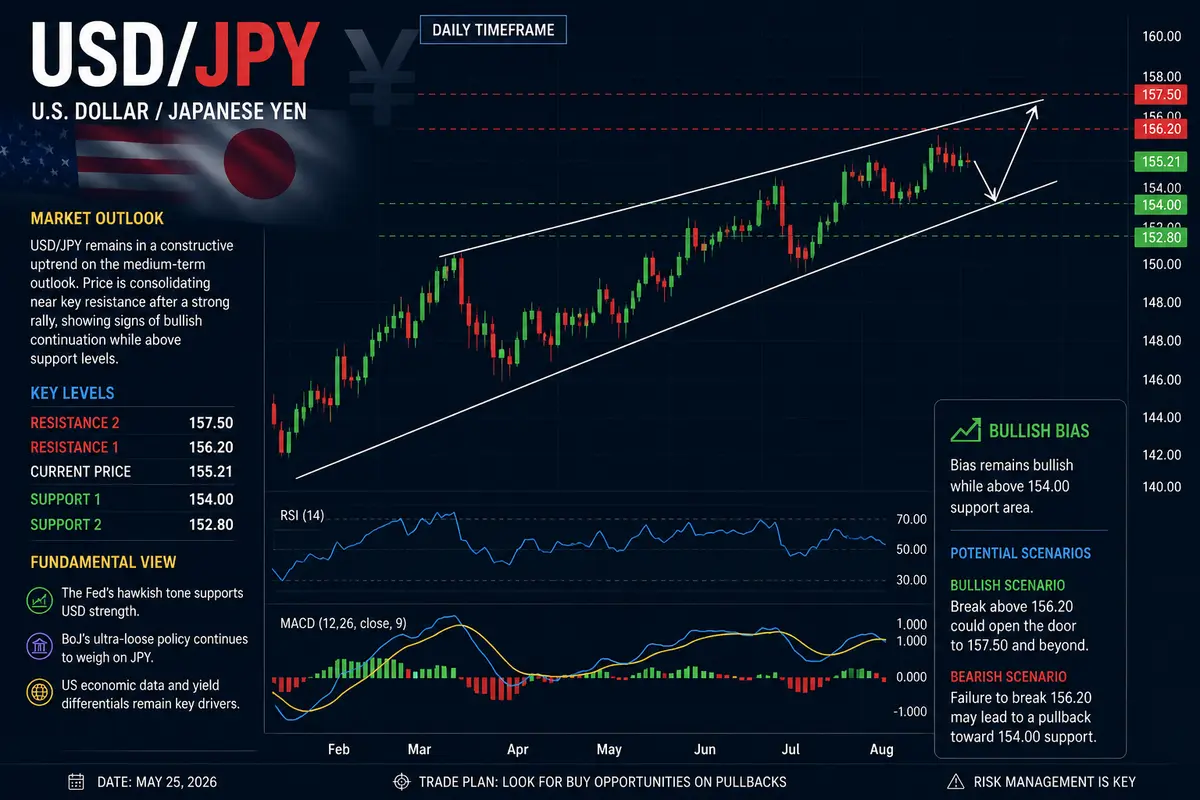
When USD/JPY establishes a strong trend backed by rising or falling bond yields, it tends to respect higher-timeframe market structure with high fidelity. Unlike GBP/USD, which frequently performs deep stop hunts, USD/JPY often leaves shallow retracements and cleanly respects 15-minute and 1-Hour Fair Value Gaps.
Institutional Order Blocks and Key Numbers
USD/JPY has a strong affinity for institutional “round numbers” (levels ending in .000 or .500, such as 150.00 or 155.50). Large options barriers and central bank order walls are regularly built around these psych levels, making them natural magnets for liquidity sweeps and sharp rejections.
Execution Framework for USD/JPY
-
Check Yield Direction: Look at the US 10-Year Treasury yield chart (TNX) on the 4-Hour timeframe to confirm if bond yields are expanding or consolidating.
-
Mark the Tokyo High/Low: Outline the range created between the Tokyo open and the London open.
-
Wait for New York Direction: Allow US economic news releases or the US stock/bond market open (08:30 to 09:30 EST) to inject volume into the pair.
-
Identify Imbalance: Look for a strong displacement candle on the 5-minute chart that breaks Tokyo range structure in the direction of US yield momentum.
-
Execute on Retest: Place an entry order at the resulting 5-minute Fair Value Gap or unmitigated Order Block, targeting the next daily major round number or liquidity pool.

Comments
No comments yet. Be the first to share your thoughts!
Authentication Required
You must be logged in to post a comment.