

Building Price Movement Forecasting Models

To know what will happen tomorrow with the prices of exchange-traded instruments — or, in other words, to forecast their future value — it is essential to understand and navigate the primary methods of market analysis. By mastering these forecasting models, traders can shift from simply guessing to making informed, data-driven decisions.
The Foundation of Market Analysis
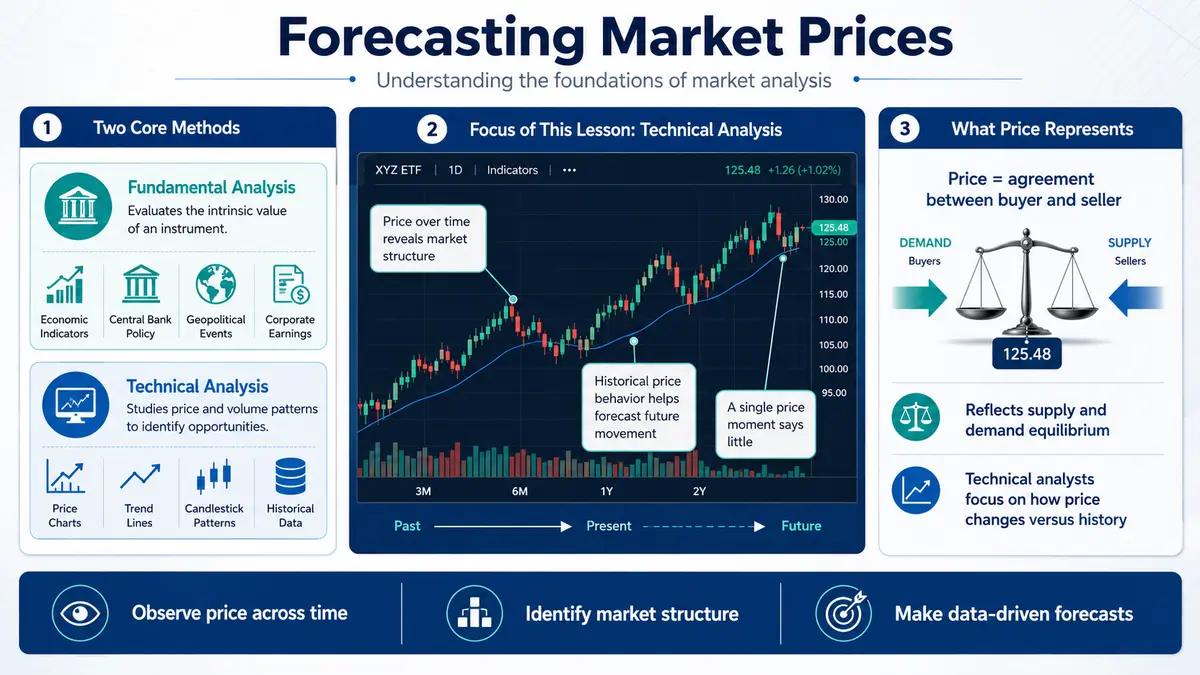
Currently, there are two main, practically proven methods: fundamental market analysis and technical market analysis. Fundamental analysis involves evaluating the intrinsic value of an asset by examining economic indicators, central bank policies, geopolitical events, and corporate earnings. We will cover fundamental analysis in more detail in upcoming lessons.
In this lesson, we will focus entirely on technical market analysis. Since technical analysis involves studying the structure of markets, we must first determine: how do we see this structure, and how is it displayed? What exactly in the markets reacts to all these global changes or events? The answer, of course, is the price of the asset!
A price at a single, specific moment in time tells us very little. However, if we observe the price across different time periods, we can see the market’s structure and how it has evolved over time. This continuous flow of price data is exactly what allows us to forecast future prices.
The price of an asset is simply the agreed-upon value at which a buyer and a seller on a trading platform (financial market) execute a trade. Based on this, we can say that price reflects the exact equilibrium between supply and demand at a specific moment. The most crucial part of this concept is that a pure technical analyst does not necessarily care what caused this equilibrium or which news events influenced it; the only thing that matters is how the price has changed compared to its historical values.
Understanding Technical Analysis
Technical analysis is a comprehensive set of tools and methodologies used to forecast probable future price movements based on patterns of past price changes under similar circumstances.
Its foundation lies in the rigorous analysis of price charts. Theoretically, technical analysis can be applied to any market — stocks, commodities, cryptocurrencies, or forex. However, it is most widely and effectively used in highly liquid, free-flowing markets where massive trading volumes prevent easy manipulation.
While technical analysis involves hundreds of different indicators, oscillators, and charting methods, they are all built on a single core assumption: price dynamics are driven by the psychology of market participants. Under the influence of basic human emotions and instincts — such as greed, herd mentality, panic, and fear — people tend to behave in predictable ways in similar circumstances. This collective behavior forms visible flows of supply and demand and creates imbalances between them, leaving identifiable “footprints” on the chart. Reading these footprints is what makes it possible to forecast price movements.
The Core Axioms of Technical Analysis
The discipline of technical analysis is built upon three foundational pillars, first introduced by Charles Dow.
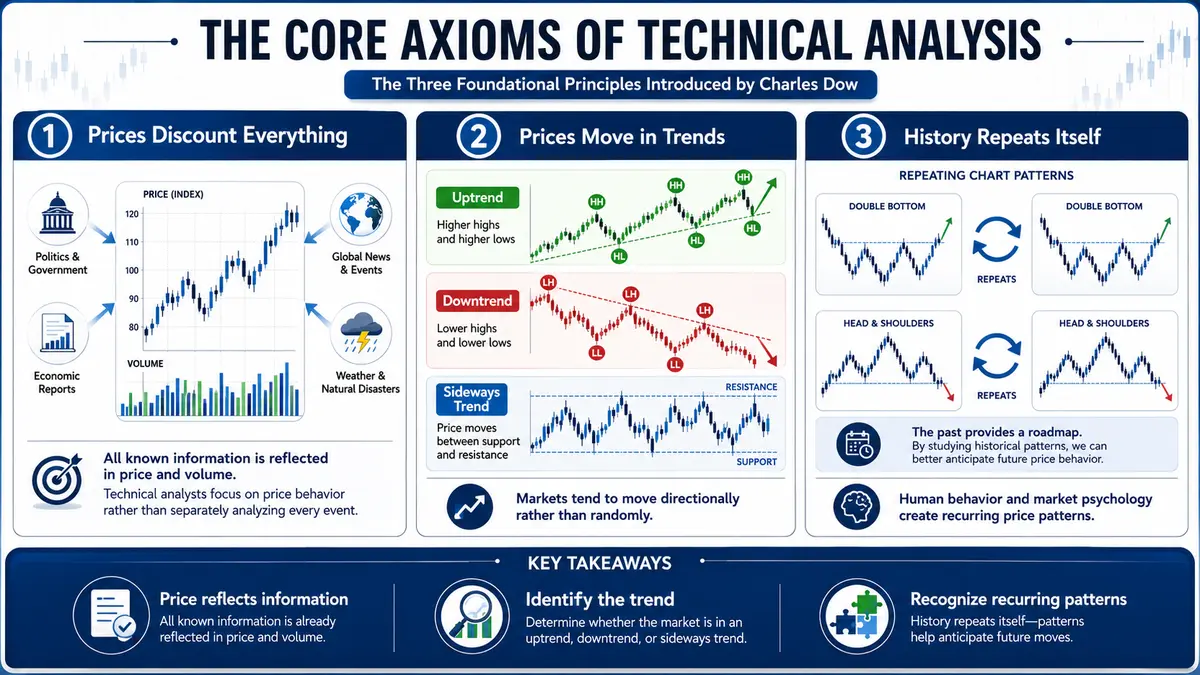
1. Prices Discount Everything According to this axiom, all known information that could possibly affect the price of an asset — whether it is a sudden political shift, an unexpected economic report, or a natural disaster — is instantly factored into the price itself and the trading volume. Therefore, technical analysts argue there is no need to separately study the fundamental impact of these events. It is enough to focus entirely on studying price and volume dynamics to determine the most probable direction of future price movement. Everything related to an asset is automatically and efficiently reflected in its current market price.
2. Prices Move in Trends A trend is a directional price movement, and the concept of a trend is arguably the most critical principle in technical analysis. You must understand that market movements are not entirely random; everything happening in the market follows certain trends. The primary goal of charting is to identify these trends in their early stages of development and trade in harmony with their direction.
-
Uptrend (Bullish Trend): If the chart displays a series of higher highs and higher lows, the market is in an uptrend. Buyers are in control, pushing prices higher despite temporary pullbacks.
-
Downtrend (Bearish Trend): If the chart displays a series of lower highs and lower lows, the market is in a downtrend. Sellers dominate the market, forcing the asset’s value down.
-
Sideways Trend (Ranging Market): If both price highs and price lows bounce between approximately the same horizontal levels, the market is currently in a sideways trend, often indicating a period of consolidation before the next big move.
3. History Repeats Itself Trading on financial markets is essentially a reflection of mass human psychology. Since human nature and psychological reactions to risk and reward do not change over the years, we can safely assume that market participants will behave in the present and future just as they did in the past.
Because these collective actions are recorded directly in the price action, certain past price behaviors and chart patterns will inevitably repeat themselves, offering lucrative opportunities for those who recognize them.
The Laws of Price Movement
Beyond the axioms, technical traders rely on a few universal laws adapted for financial markets:
-
An existing trend in motion is statistically much more likely to continue than to reverse its direction abruptly.
-
A trend will continue to develop in the same direction until it shows clear, mathematical, or structural signs of a reversal (such as breaking a major support or resistance level).
Calculating Potential Trade Profit
Technical analysis not only provides us with entry and exit points but also gives us the ability to calculate the potential profit or risk of a trade before we even open it. Let’s break down exactly how to do this using a standard currency pair.
Calculating profit on the EUR/USD currency pair in US Dollars (USD): Unlike cross pairs or indices where we might need an additional conversion rate, trading EUR/USD makes calculating profit in USD very straightforward, as the quote currency (the second currency in the pair) is already the US Dollar.
-
1.00 standard lot in Forex consists of 100,000 units of the base currency.
-
Opening Price (Buy Order): 1.08500
-
Closing Price (Take Profit hit): 1.08900
The Calculation Step-by-Step:
-
Determine the price difference: 1.08900 (Close) – 1.08500 (Open) = 0.00400 (This is a 40-pip movement).
-
Multiply the price difference by the contract size to find the profit: 0.00400 * 100,000 (Contract size for 1 lot) = $400.
-
Since our trading account and the quote currency are both in USD, no further conversion is needed. The total profit from this executed trade is exactly $400.
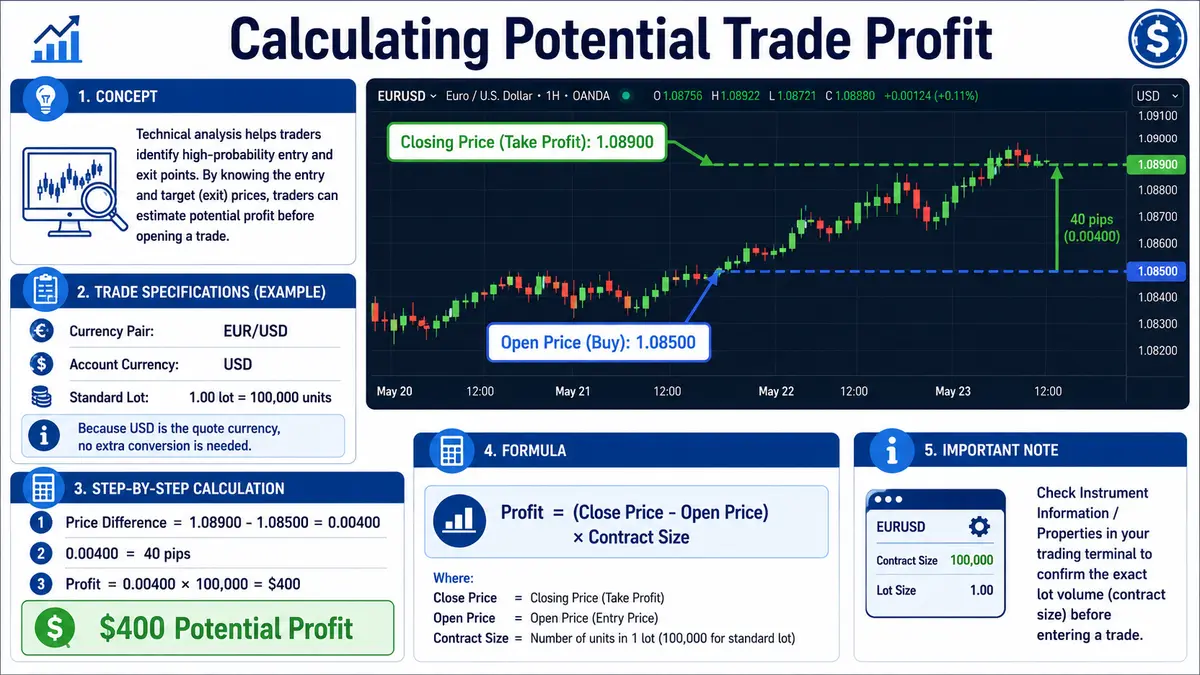
To find the specific contract specifications for any asset you trade, simply navigate to the “Instrument Information” or “Properties” tab in your trading terminal.
There, you can view the exact Lot Volume (contract size) to ensure your risk management calculations are accurate before entering a position.

Comments
No comments yet. Be the first to share your thoughts!
Authentication Required
You must be logged in to post a comment.