Daily Analysis 3 July 2026 | Markets Reel as Weak US Jobs Data Hits Dollar, Lifts Gold

Currency & Commodity Analysis:
US Dollar Index
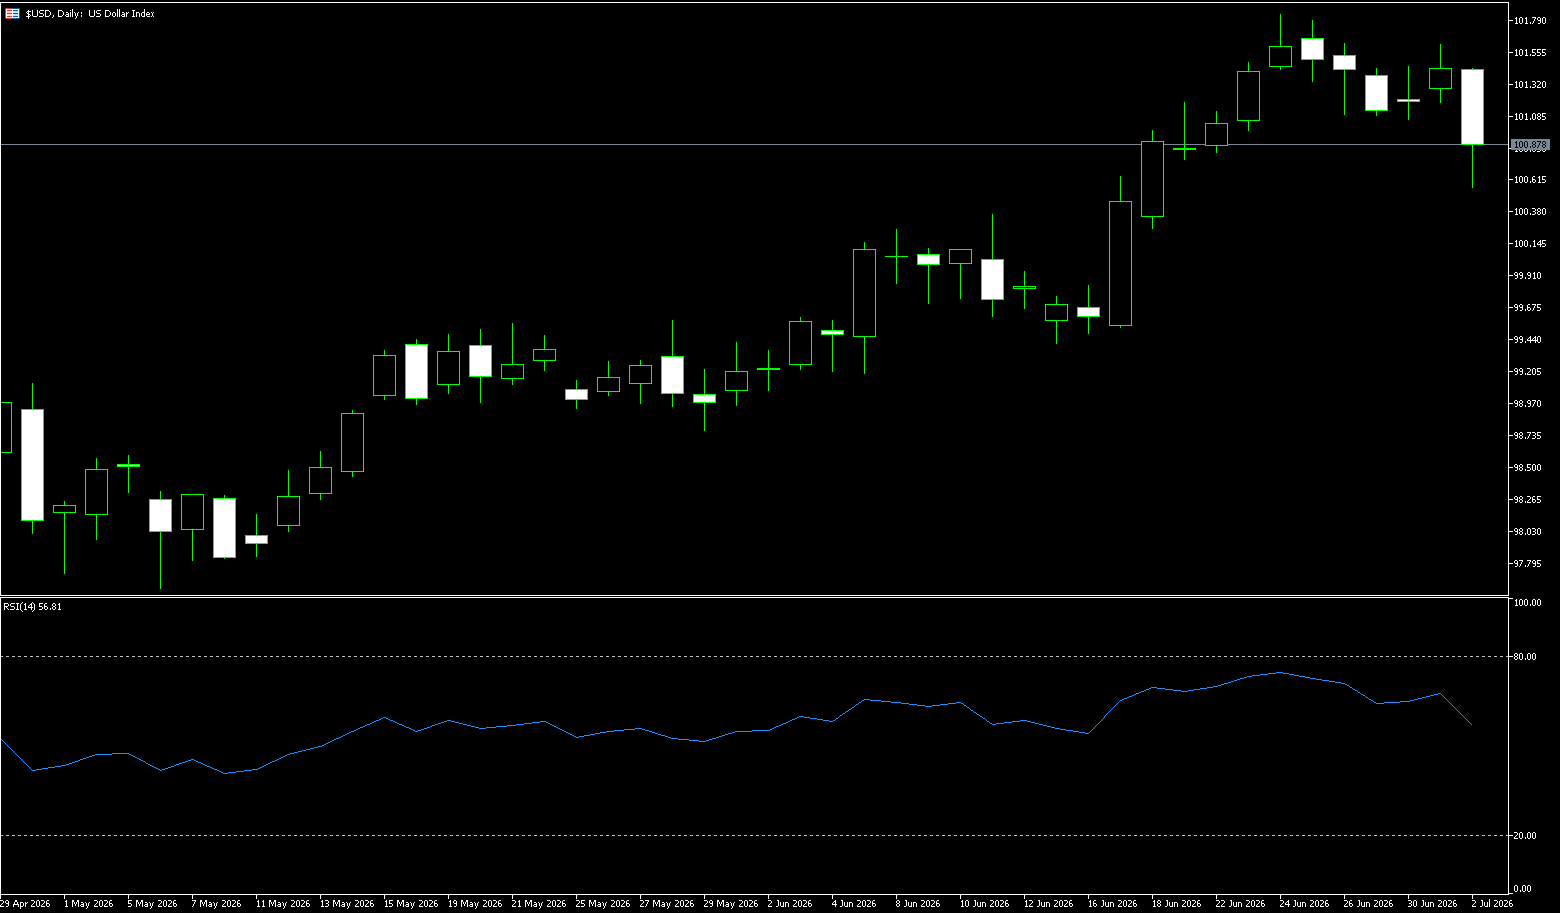
Non-Farm Payrolls (Significant Decline): The actual increase was only 57,000, more than halved from the previous value of 170,000 (Note: the official value was 172,000), and far below the market expectation of 110,000. This indicates that the actual hiring intentions of US companies are on the verge of recession. The “ADP employment report showing only 98,000 new jobs,” which was dismissed by the market a few days ago, turned out to be a genuine harbinger of an industry peak. In the foreign exchange market, this contradictory data triggered a sharp short-term “fan-like” price movement (sweeping orders up and down): the US dollar index fluctuated downwards: immediately after the data release, due to the unexpectedly low figure of 57,000, the US dollar index plummeted, directly testing the low of the trading range at 100.55. However, due to the still strong unemployment rate (4.2%) and wages (3.5%), the US dollar index quickly recovered some of its losses after hitting the low, indicating that the market is repeatedly tug-of-war between “speculation on the Fed’s dovish stance” and “concerns about stagflation.” The middle line of the long-term downward channel from 2022 to 2026 is currently undergoing a fierce battle for its position.
The current strengthening of the US dollar is not driven by a single factor. The Federal Reserve’s completely hawkish shift in monetary policy, the stronger-than-expected resilience of the US job market, repeated geopolitical disturbances between the US and Iran, and a surge in US dollar and Treasury bond allocations driven by safe-haven buying in global equity markets—multiple factors have combined to create the current strong dollar. Simultaneously, the market has exhibited a unique divergence, with the dollar rising and US Treasury yields falling. The bullish trend of the US dollar index remains unchanged, and it is highly likely to steadily test the 102.00 level. Going forward, the key factors constraining the dollar’s rise will remain to be monitored: a renewed easing of tensions between the US and Iran, and a recovery in global risk appetite. Technically, the US dollar index has broken through a long-term consolidation range, resolving the double-top crisis, with target prices at 101.80 and subsequently 102.14. On the downside, watch 100.34 (the 25-day moving average) and 100.00 (a psychological level).
Today, consider shorting the US Dollar Index at 100.98, with a stop-loss at 101.10 and targets of 100.50 and 100.40.
WTI Crude Oil
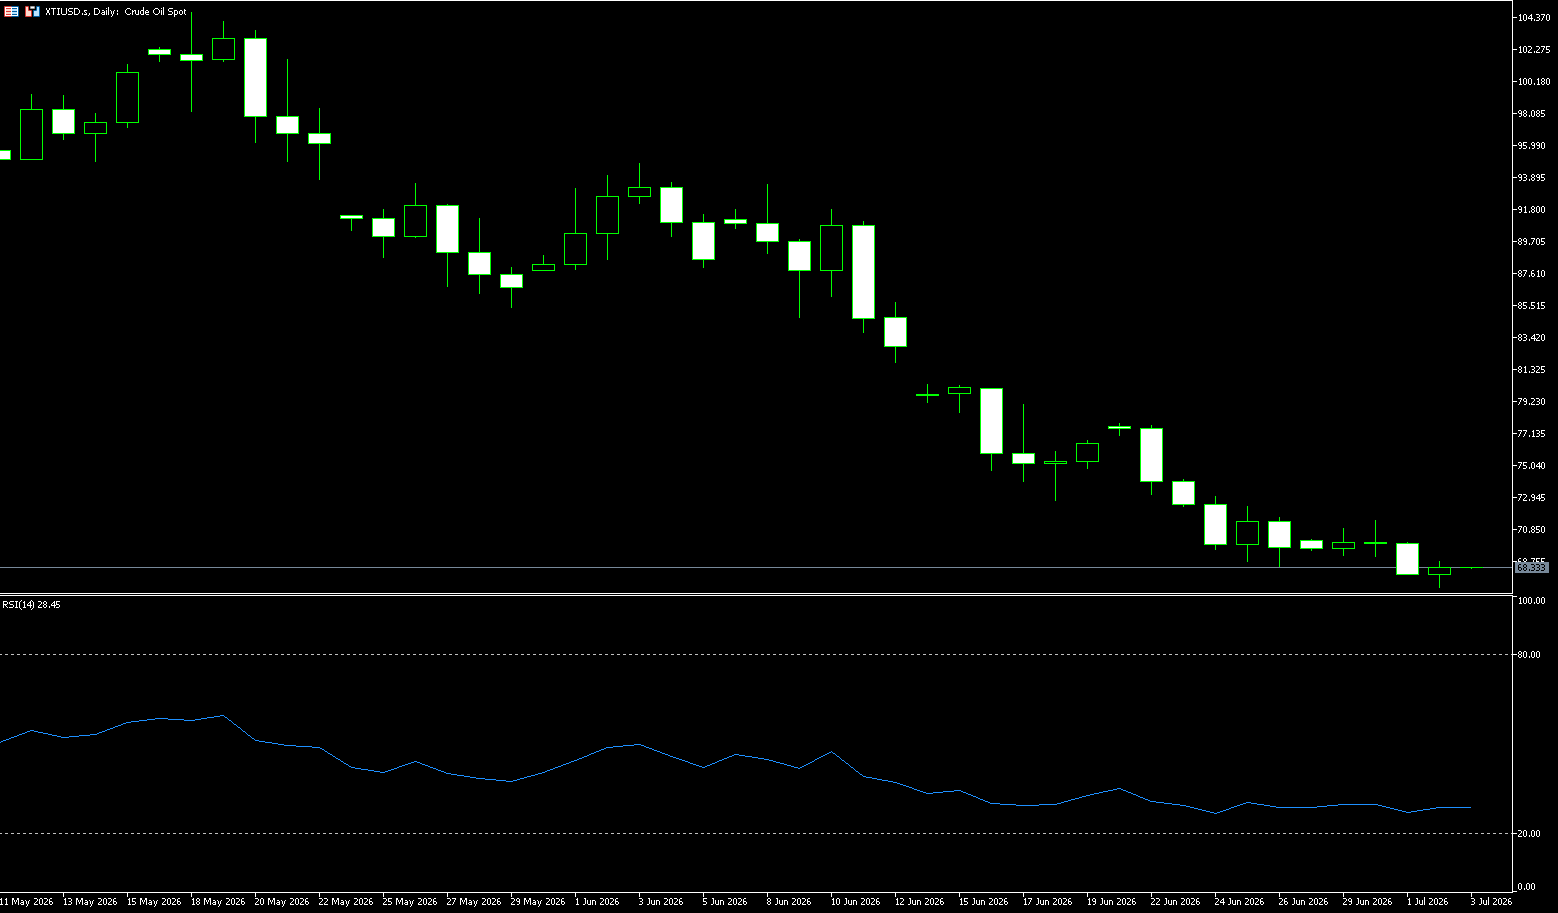
On Thursday, crude oil prices fell to around $68 a barrel, reaching their lowest level since late February, as oil shipments through the Strait of Hormuz continued to increase, and investors welcomed progress in indirect negotiations between the US and Iran. A US official stated that, with the support of the US military, crude oil flows through this strategic waterway exceeded 10 million barrels per day. The UAE’s oil exports have also recovered to pre-war levels through workarounds. Meanwhile, Iranian oil exports surged to over 40 million barrels after the lifting of the US naval blockade, while record Russian oil shipments led to a significant increase in seaborne inventories. President Trump praised progress in negotiations, and Qatar indicated the next round of talks would be held as soon as possible. However, Tehran maintains its maritime administrative control over the Strait of Hormuz.
Investors are closely watching the progress of subsequent negotiations and global demand. If global economic growth remains stable, particularly driven by the summer travel season, crude oil consumption demand is expected to continue to provide some support for oil prices. Furthermore, changes in US crude oil inventories, OPEC+ production policies, and manufacturing activity data from major global economies will continue to influence future market trends. From a daily chart perspective, WTI crude oil has been trading within a downward channel since its previous high, currently trading around $67.40, and remains in a bearish trend. The moving average system exhibits a bearish alignment, reflecting a continued weak medium-term market trend. The key support levels are currently at $66.00 and $65.00. A break below these levels could see oil prices further test support near $64.81 (the low of February 27th). On the upside, key resistance levels to watch are $70.00 (a psychological level) and $74.50 (the 9-day moving average). Only a sustained move above $73 would allow the market to reverse its recent downward trend.
Today, consider going long on crude oil at $68.26, with a stop-loss at $68.10 and targets of $70.00 and $71.00.
Spot Gold
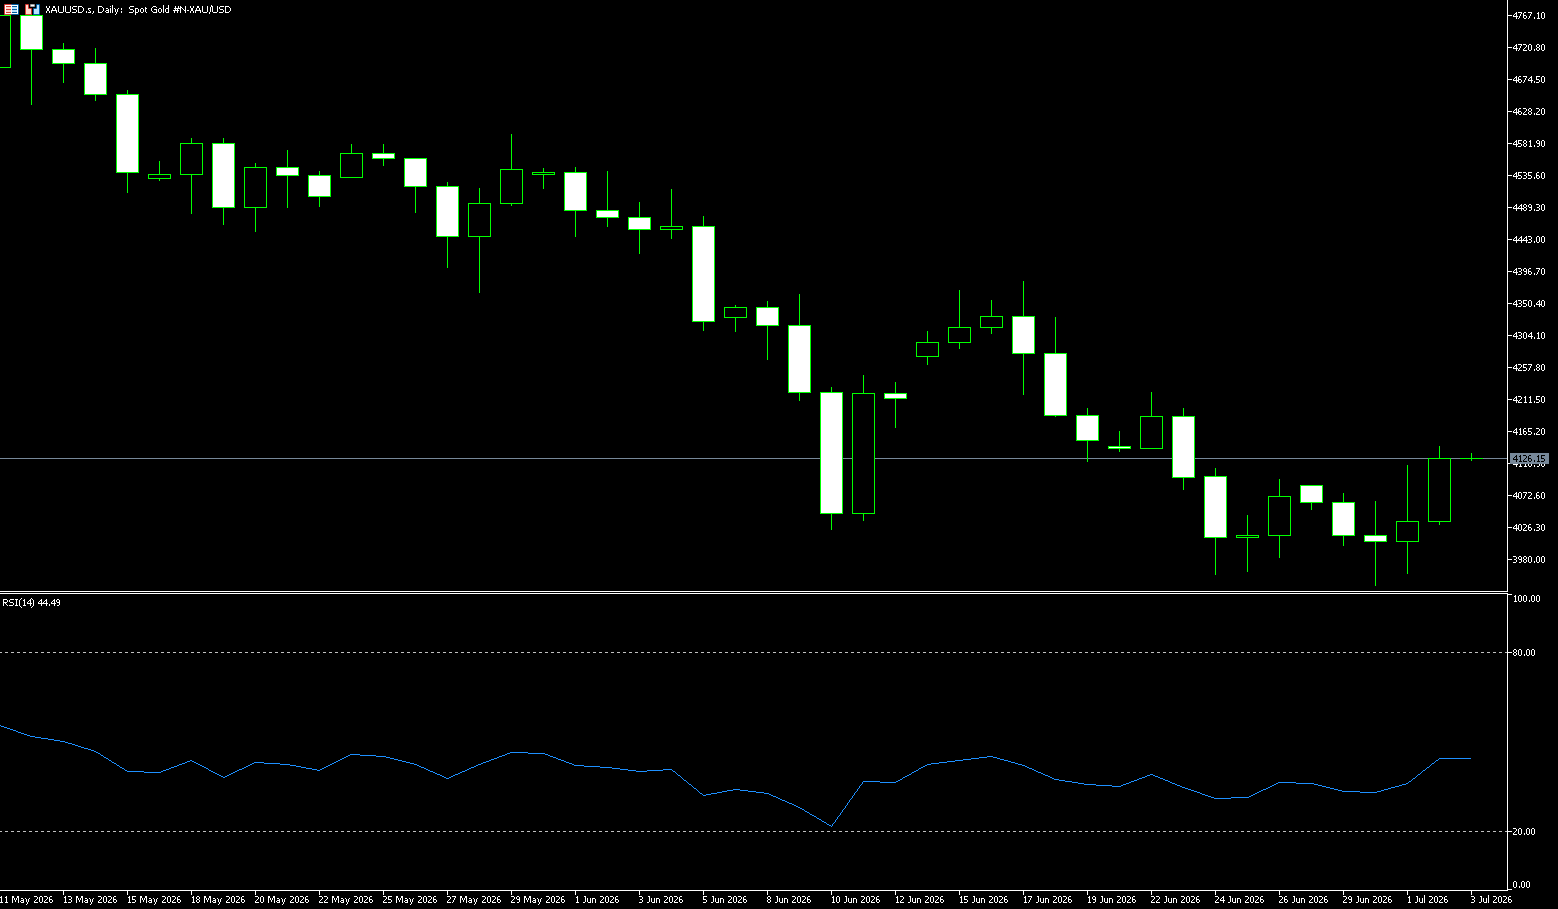
On Thursday (July 2nd) at 20:30 Beijing time, the U.S. Bureau of Labor Statistics released its June non-farm payroll report. The market reacted sharply immediately after the release. The U.S. dollar index fell by about 40 points, hitting a low of 100.55, while spot gold surged, breaking through the $4100 level and continuing to rise. Short-term interest rate futures indicate that market expectations for a December rate hike by the Federal Reserve have been reduced, with a significant decrease in the probability of a July rate hike. The market reacted sharply immediately after the release. The US dollar index fell by about 70 points in the short term, and US Treasury yields declined, with the 10-year and 2-year yields falling by about 4-5 basis points respectively. Spot gold surged, breaking through the $4,100 mark and rising further. Overall, this non-farm payroll data reinforced the narrative of a soft landing for the economy but with slowing growth momentum, putting temporary pressure on the US dollar and providing support for precious metals and some non-US currencies. The decline in US Treasury yields also reflects a reassessment of expectations for policy easing.
From a technical perspective, the overnight short-covering rebound encountered resistance near the 38.2% Fibonacci retracement level of the recent decline over the past two weeks. Furthermore, the gold price remains below the 14-day simple moving average of $4,128, reinforcing the short-term bearish bias. However, momentum indicators are improving, with the MACD indicator turning upward above the zero line and the Relative Strength Index (RSI) remaining around 39. Furthermore, a hold above the 23.6% Fibonacci retracement level would support further upward attempts, but would still be constrained by the existing structure. Meanwhile, short-term resistance lies at the 14-day simple moving average at $4,128, followed by the 20-day simple moving average at $4,161 and the 50% Fibonacci retracement level at $4,164.62. A break below this level could lead to the $4,200 mark. On the downside, initial support is at the reclaimed 23.6% Fibonacci retracement level of $4,047.62. A further decline to $4,000 (a psychological level) would further expose a structural bottom, around the swing low of $3,943.03.
Today, consider going long on gold at 4,120, with a stop-loss at 4,115 and targets at 4,185 and 4,195.
AUD/USD
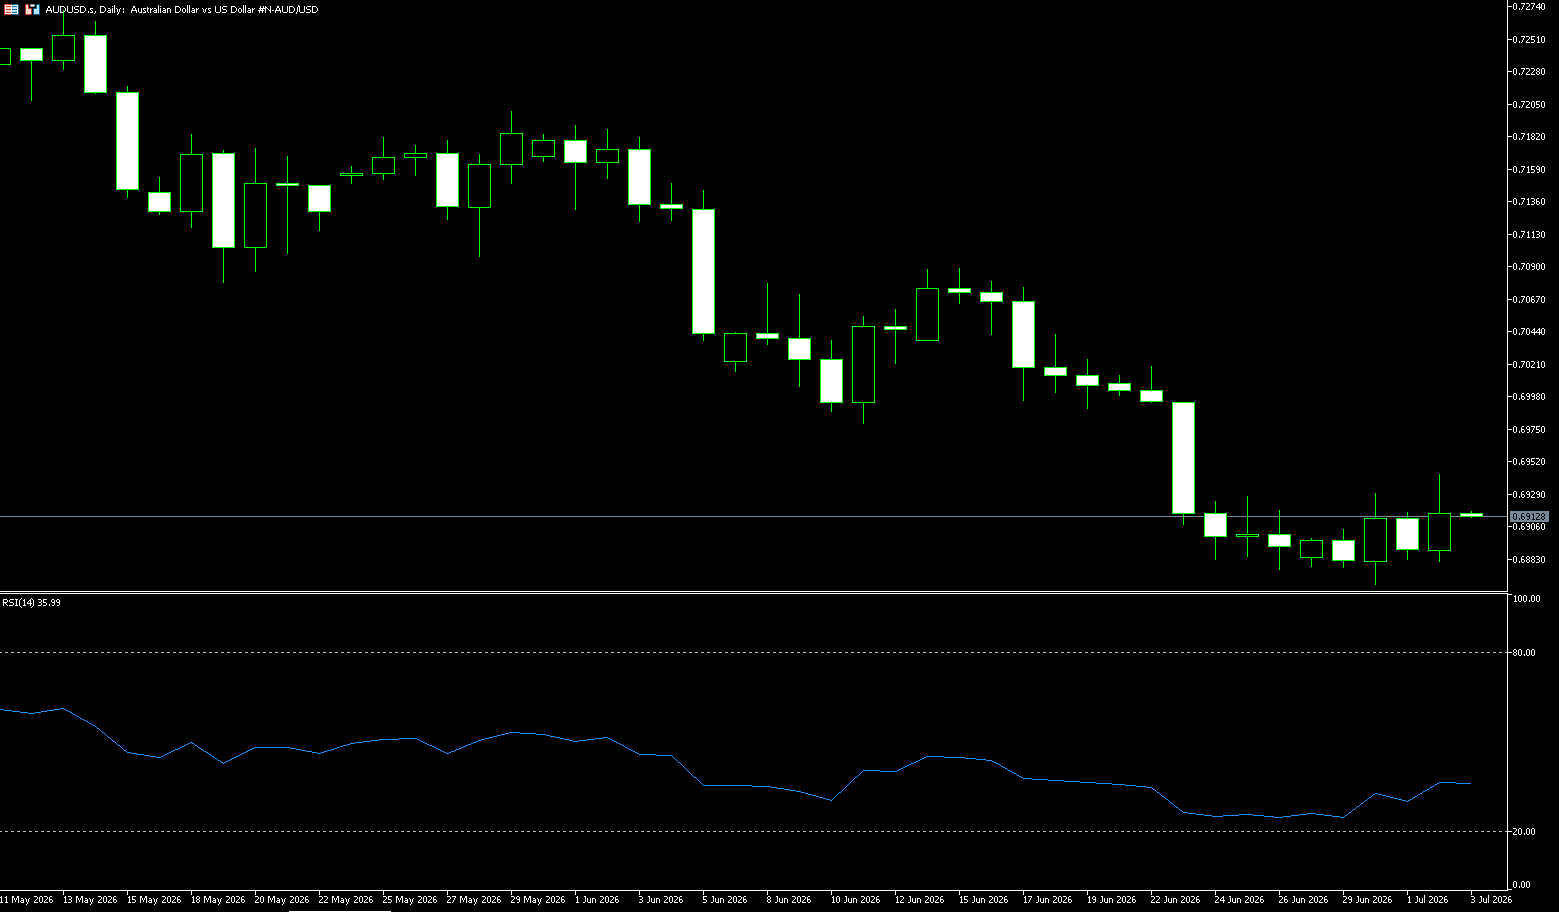
The Australian dollar rebounded against the US dollar during Thursday’s European session, trading around 0.6920. According to data released by the US Bureau of Statistics, US non-farm payrolls increased by 57,000 in June, lower than the market expectation of 110,000. The broad decline in the US dollar offset the impact of the Australian trade deficit data, maintaining support for the currency pair. However, gains were limited due to uncertainty surrounding US-Iran negotiations and the upcoming important US non-farm payroll report. The AUD/USD pair fell for the eighth consecutive trading day, trading around 0.6900 during Thursday’s Asian session. The pair remained weak as the Australian dollar continued to be pressured following the release of Australian labor market data. According to the latest data from the Australian Bureau of Statistics, the Australian labor market showed strong signs of recovery in May, with the unemployment rate slightly decreasing to 4.4% from 4.5% in April, exactly in line with market expectations. In-depth analysis of the data shows that although the overall participation rate remained unchanged at 66.7%, the labor force expansion was mainly driven by part-time jobs. As market expectations for a Fed rate hike later this year intensify, the US dollar may continue to rise, weakening the AUD/USD pair.
On the daily chart, the AUD/USD pair is trading around 0.6920, continuing its bearish trend below the 55-day and 100-day simple moving averages, at 0.7124 and 0.7083 respectively. Although it holds above the 200-day simple moving average of 0.6857, this still structurally limits the pair’s performance. The 14-day Relative Strength Index (RSI) is deep in oversold territory, near 30, while the Average Directional Index (14) has risen strongly above 35, indicating continued downward pressure even if the sell-off risk may be excessive. On the downside, initial support is at 0.6856 near the 200-day simple moving average, followed by nearby horizontal support at 0.6833; a clear break below this area would expose subsequent support at the 0.6800 level. On the upside, any rebound attempt faces immediate resistance at the 0.6945 level (5-day simple moving average) and the 0.7000 level (psychological level).
Consider going long on the Australian dollar at 0.6910 today, with a stop loss at 0.6900 and targets at 0.6950 and 0.6960.
GBP/USD
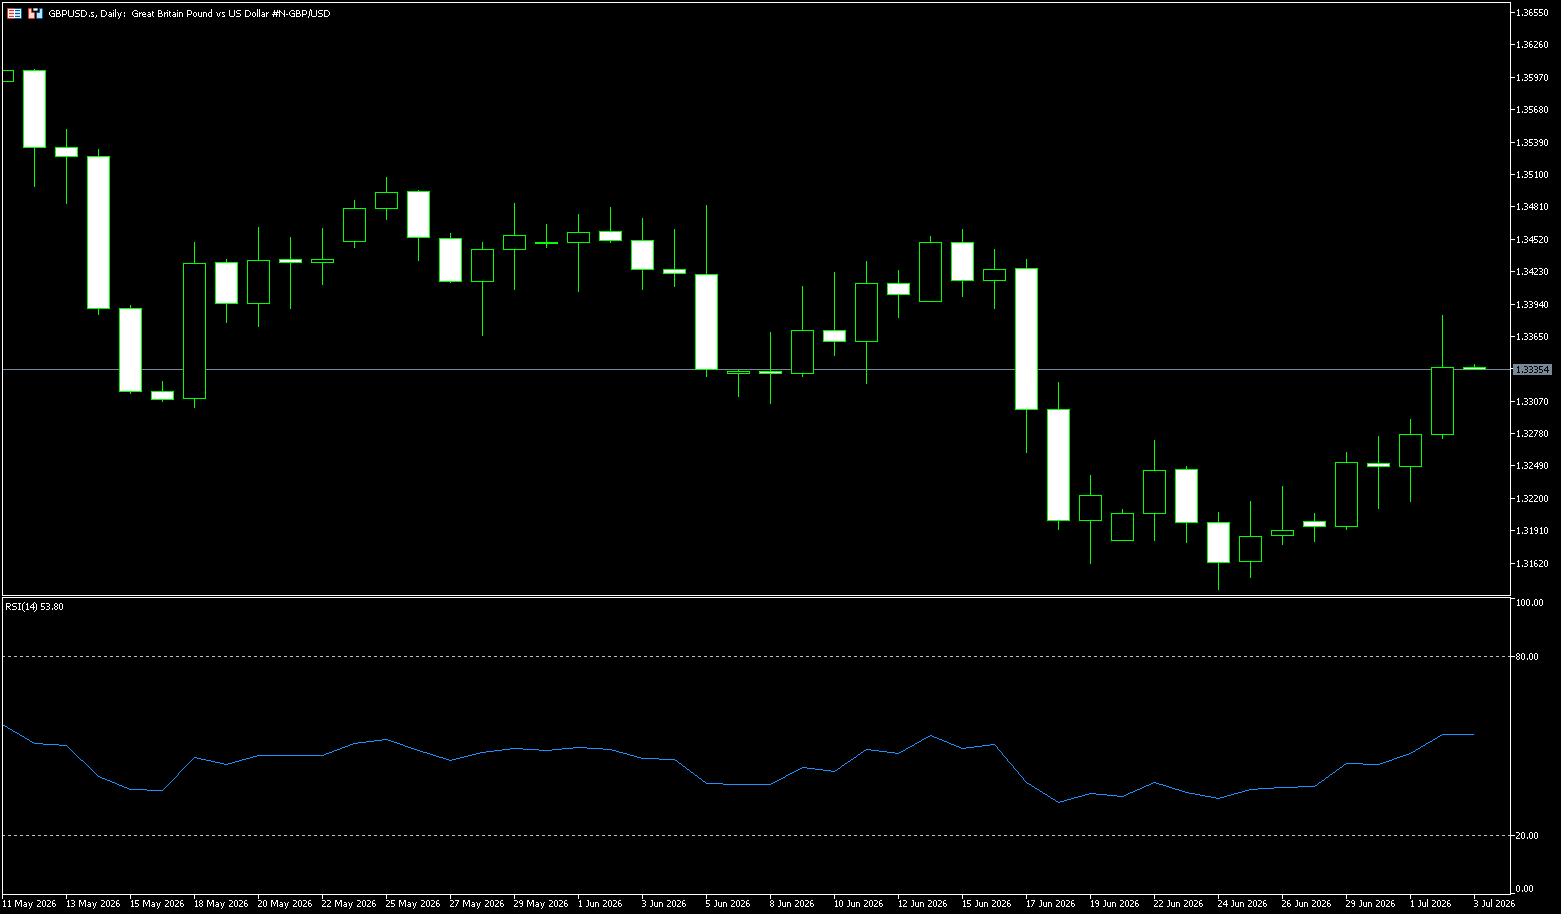
The pound rose 0.65% against the dollar in Thursday’s European trading session, recovering some lost ground. It is approaching 1.3360. The US Bureau of Labor Statistics released its June non-farm payroll report, which triggered a sharp market reaction. The dollar index fell by about 70 points in the short term, hitting a low of 100.55, while the pound surged. The dollar underperformed other major currencies, pushing the GBP/USD exchange rate higher. However, given the political instability in the UK and rising market expectations for a US interest rate hike this year, the potential upside for this major currency pair may be limited. British Prime Minister Keir Starmer resigned on Monday, plunging the country into another political crisis. Starmer resigned under immense pressure after Andy Burnham won the Mekfield by-election last week. His Labour Party now needs to elect a new leader to govern the country. Traders will be closely watching Burnham’s policy direction. Analysts warn that Burnham’s expansionary fiscal stance, higher taxes, and increased government bond issuance could put pressure on the pound against the dollar.
From the current market structure, UK political risk, the Federal Reserve’s hawkish stance, and the overall strength of the dollar remain the core factors dominating the pound’s movement against the dollar. In the short term, without new positive news, the pound may continue to face downward pressure. Technically, the pound has broken below its previous consolidation range on the daily chart, and a downward trend is gradually being established. The price continues to trade below major moving averages, indicating an overall bearish market. The MACD indicator is below the zero line, and the green histogram is expanding, reflecting that bearish forces are dominant. Key resistance levels to watch are 1.3421 (65-day moving average) and 1.3400 (psychological level). If the price cannot regain a foothold above 1.3300, the upside potential is expected to be limited; further resistance lies near 1.3460 (June 15 high). Support is seen at the 1.3300 level; a daily close below this level would confirm a break and open the way to 1.3268 (Thursday’s low).
Consider going long on GBP at 1.3338 today, with a stop loss at 1.3326 and targets at 1.3390 and 1.3400.
USD/JPY
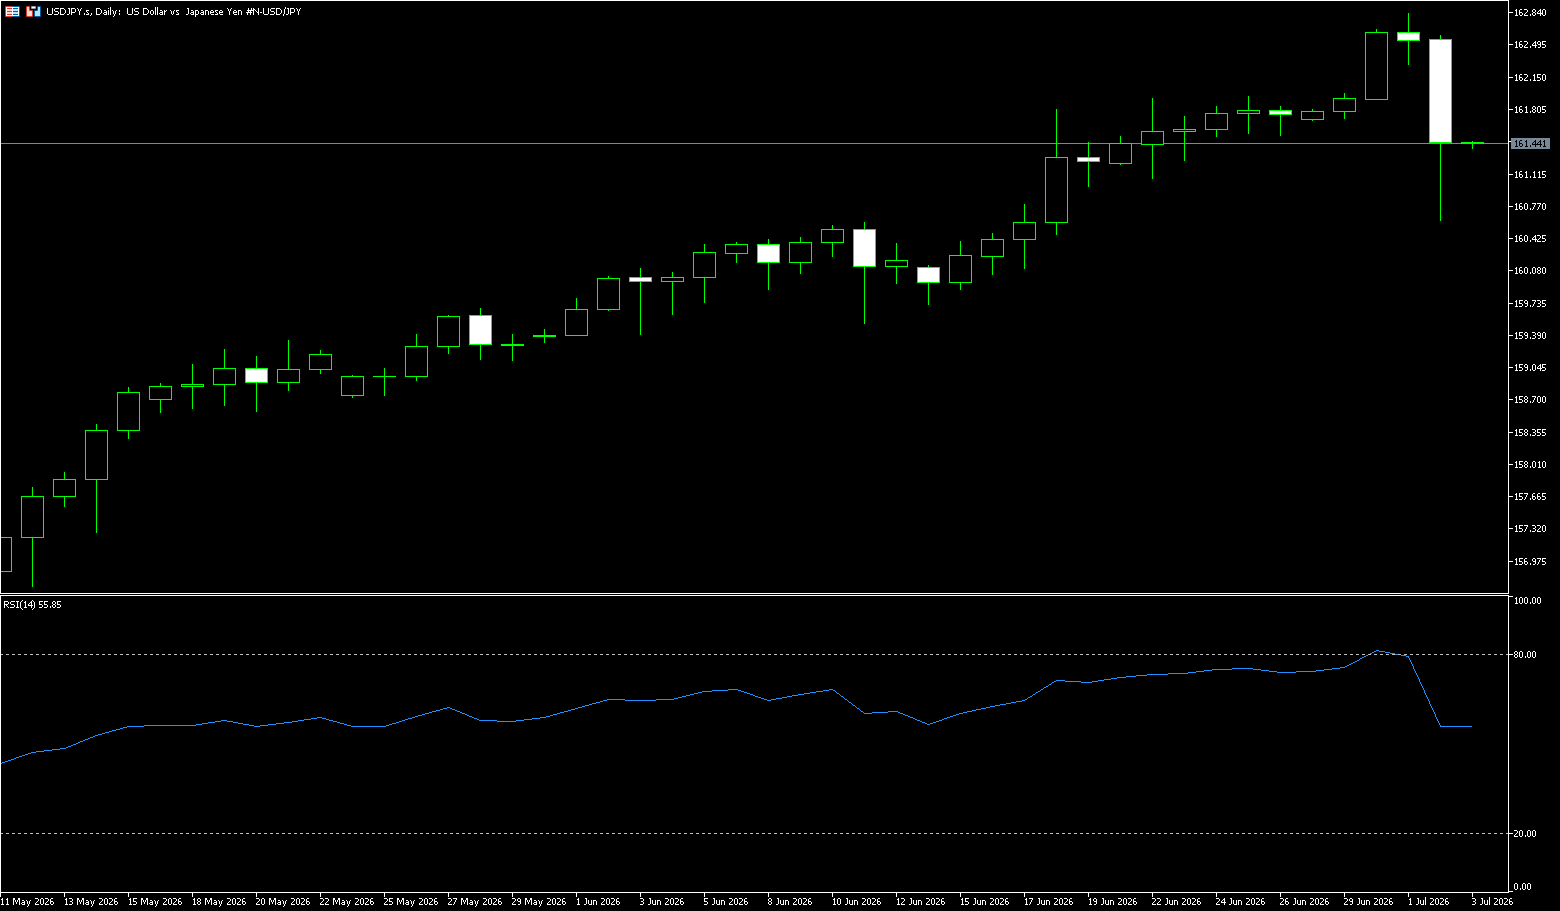
The US Bureau of Labor Statistics released its June non-farm payrolls report. Data showed that only 57,000 jobs were added in June, far below the market expectation of 115,000; April and May data were revised down by a combined 74,000. The USD/JPY pair fell more than 100 points to 160.65, as traders speculated about potential foreign exchange market intervention as Japanese authorities had not yet issued an official statement. Earlier this week, Finance Minister Satsuki Katayama stated that she had met with US Treasury Secretary Scott Bessenter, reaffirming their shared commitment to coordinating foreign exchange markets if necessary. The yen remains under pressure due to a stronger dollar and the large interest rate differential between the US and Japan. Markets are skeptical of Tokyo’s willingness to engage in further monetary intervention, following a record-breaking intervention in the past two months that significantly reduced foreign exchange reserves. Meanwhile, the summary of the Bank of Japan’s June meeting showed that policymakers generally supported continued interest rate hikes, citing progress towards the 2% target for underlying inflation and still-accommodative financial conditions.
Overall, the USD/JPY pair is expected to continue its volatile trading pattern in the short term. The Fed’s hawkish stance and rising expectations of interest rate hikes provide support for the exchange rate, while the deterrent effect of Japanese government intervention and potential adjustments to the Bank of Japan’s interest rate hikes continue to limit the upside potential. The key factors for future market movement will focus on changes in Fed policy expectations, the pace of Japanese intervention, and the performance of domestic inflation data in Japan. With these alternating bullish and bearish factors, the USD/JPY pair is unlikely to establish a clear trend in the short term. From a daily chart perspective, the USD/JPY pair remains in a clear upward trend. The price continues to trade above major moving averages, maintaining a complete medium- to long-term bullish structure. Currently, the exchange rate is holding above the key psychological level of 160.00, indicating that buying power remains dominant in the market. The key upside target is the historical high area of 162.00. A decisive break above this level could open up further upside potential, targeting the 163.50 and 165.00 areas. On the downside, watch for support at 160.00 and 158.70. The 158.70 level is also close to the 20-week exponential moving average, making it a significant reference point for medium-term trends.
Today, consider shorting the US dollar at 161.30, with a stop-loss at 161.45 and targets at 160.50 and 160.30.
EUR/USD
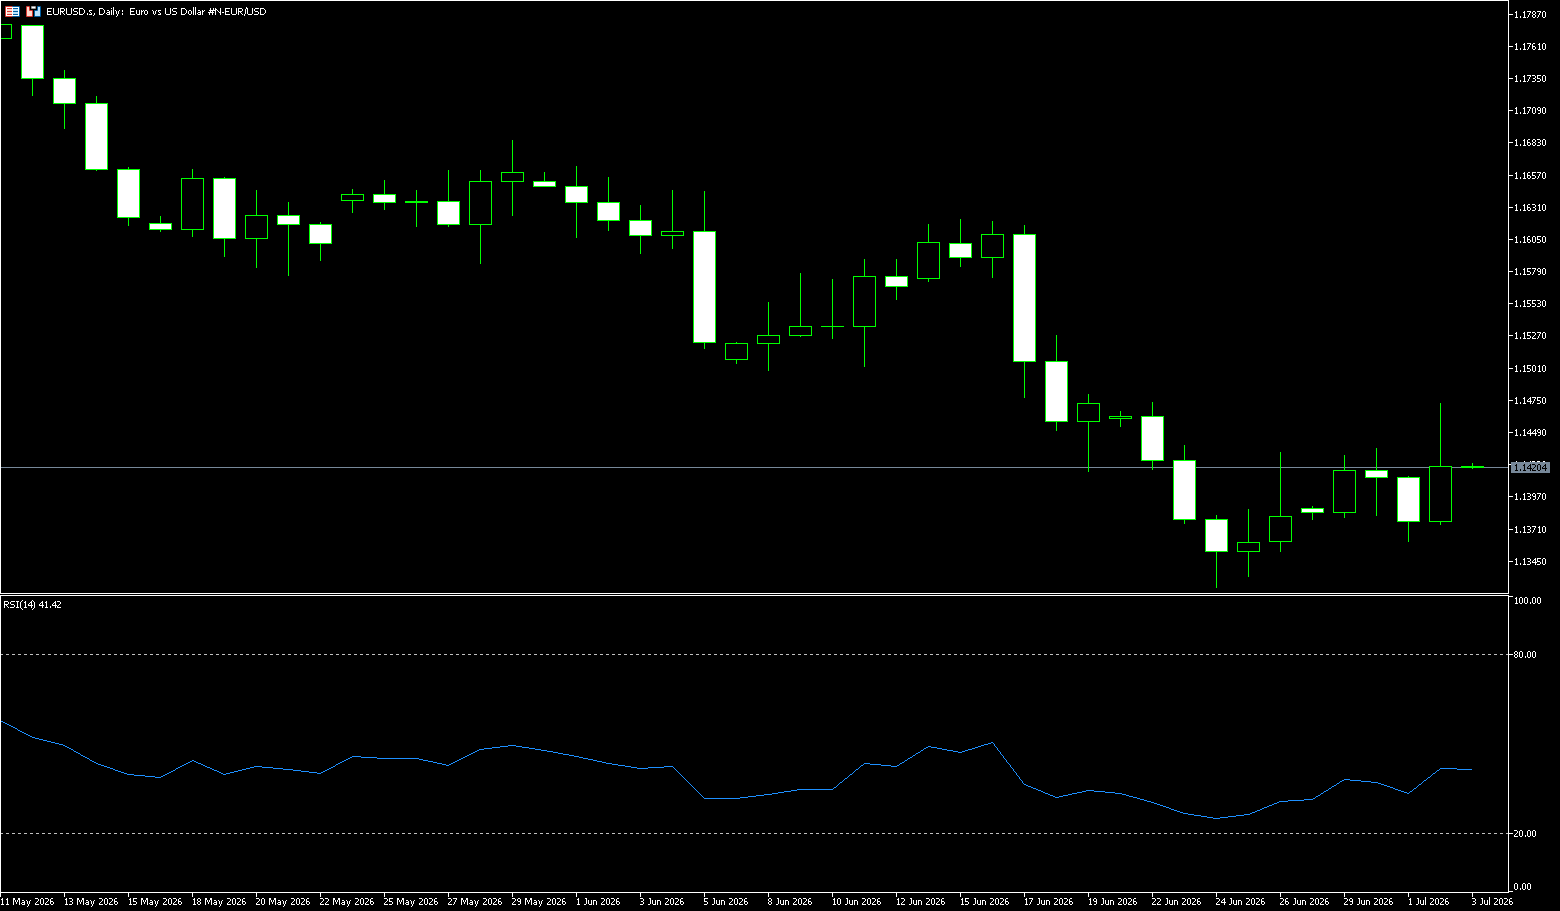
On Thursday evening Beijing time, the US Bureau of Labor Statistics (BLS) released its June non-farm payroll data, which ignited global financial markets. This was undoubtedly the most astonishing non-farm payroll report for Wall Street since the beginning of 2026. EUR/USD rose to around 1.1440 in Thursday’s European session. The euro fell to its lowest level against the dollar since June 2025 as traders increased their bets on a US interest rate hike later this year. Traders have been preparing for the Federal Reserve’s expected rate hikes this year since new Chairman Kevin Warsh indicated he would focus on inflation and that the overall economy appears robust. Easing tensions between the US and Iran have helped curb oil prices and increased market expectations of a more dovish stance from the European Central Bank. This could weigh on the euro in the short term.
From a technical perspective, spot prices have remained below the 200-period simple moving average on the 4-hour chart, maintaining a short-term bearish tone. Furthermore, the Moving Average Convergence Divergence (MACD) indicator is in negative territory, while the Relative Strength Index (RSI) is hovering around 40. These momentum indicators collectively suggest that downward pressure remains even if EUR/USD attempts to stabilize above recent swing lows. Therefore, any subsequent gains are more likely to encounter resistance near the 1.1500-1.1550 support level, before reaching the psychological level of 1.1600. Meanwhile, the 200-period simple moving average at 1.1590 should act as strong resistance for bulls to regain control and alleviate the current bearish bias, initiating a more sustained rally. On the downside, a break below 1.1400 would risk further weakness in EUR/USD to 1.1350, as momentum remains skewed downwards.
Consider going long on EUR/USD today at 1.1425, with a stop-loss at 1.1415 and targets at 1.1460 and 1.1470.
Stock Analysis:
Australian ASX 200 Stock Index
Basic Market Overview:
The Australian Securities Exchange (ASX) 200 index closed nearly flat on Thursday at 8724 points, after falling earlier in trading. Gains in consumer services, healthcare, and financial sectors were offset by declines in retail trade, logistics, and energy and mining. Traders were focused on Australia’s May trade data, which unexpectedly showed a deficit as exports declined while imports rose. With easing tensions in the Middle East and the reopening of the Strait of Hormuz, markets also lowered expectations for further Australian interest rate hikes as inflation risks eased. Meanwhile, US stock index futures were mainly lower, driven by weakness on Wall Street on Wednesday, with markets remaining cautious ahead of key non-farm payroll data. Northern Star Resources shares rose 5.3% after appointing a new CEO and releasing preliminary annual gold sales that met revised guidance. Meanwhile, shares of the four major banks rose between 0.4% and 3.5%. Declining stocks included SGH Ltd. (-4.6%), Wesfarmers Ltd. (-4.4%), Riess Ltd. (-3.3%), and Coles (-1.8%).
Sector Performance:
Leading Sectors (from highest to lowest gain)
Materials (Core leader, +1.7%~1.85%)
Driven by: Stronger copper, iron ore, and industrial metal prices; improved Chinese manufacturing PMI boosting resource demand expectations.
Key Stocks:
• South32 (S32) +5.0%
• Fortischutz Metals FMG +3.8%
• Rio Tinto +2.0%, BHP Billiton +1.7%
Real Estate Investment Trusts (A-REITs) (+1.7%)
Rising interest rate cut expectations and a recovery in real estate valuations led to a 2.7% increase in retail real estate leader Scentre Group.
Healthcare (+1.08%)
Defensive funds flowed in, with biopharmaceutical and medical device stocks generally rising.
Largest Declining Sector (Significant Loss)
Information Technology (-0.7%~-0.73%, Weakest Performer)
Drag on by: Overnight sharp drop in the Nasdaq, funds rotated from high-valuation growth stocks to value resource stocks, putting pressure on long-term growth stocks.
Largest Declining Stocks: Xero, WiseTech Global, and Appen all weakened.
Consumer Staples (-0.63%)
Supermarkets and food sectors retreated, with leading supermarkets Coles and Woolworths experiencing slight declines.
Telecommunications Services (-0.55%)
Defensive sectors saw fund outflows and underperformed the broader market.
Technical Analysis:
The current market is volatile and weak, with the daily chart indicating a short-term correction, but the medium-term upward trend has not been completely broken. Thursday’s market trend was clear: funds flowed out of technology and consumer defensive stocks and into commodities and raw materials sectors, while expectations of interest rate cuts supported a simultaneous rise in real estate and trust stocks. The overall market volatility was minimal, with little divergence between bulls and bears. Following the previous day’s bearish engulfing pattern, Thursday continued the weak consolidation without a clear reversal candlestick pattern. A close above 8600 would indicate short-term consolidation; a break below 8600 would open up downside potential to 8560. The index is trading below the 5-day moving average, indicating significant pressure; the 50-day moving average at 8600 is a key medium-term support level, while the 200-day moving average at 8200 provides strong support. Short-term moving averages are turning downwards, creating bearish pressure, while medium- and long-term moving averages remain upwards, maintaining the overall bullish trend. The RSI (Rate Sequencing Index) 14 is at 42, in the neutral-to-bearish range. It hasn’t entered oversold territory, but there’s still room for further downward momentum, and there’s no obvious bullish divergence. The MACD histogram shows a slight increase in the green bars on the daily chart, with the DIFF line crossing below the DEA line, confirming a short-term bearish signal. Market breadth is also a concern: only 39% of stocks are above their 20-day moving average, indicating significant market divergence. Resource stocks are dragging down the overall market, while banks are supporting the market.
Trading Strategy:
The following are technical trading ideas only and do not constitute investment advice. Leveraged trading may result in losses exceeding the principal.
Buy on Dips (Only for short-term rebound, light position):
Entry: Enter a small long position near 8600 if a bottoming signal appears (long lower shadow, RSI oversold).
Stop Loss: 8580 (Abandon long position if mid-term support is broken).
Target: 8680-8720. Exit all positions upon reaching resistance levels. Do not hold long positions overnight.
Bearish Main Strategy:
Conditions for Holding Short Positions: The index continues to trade below 8600 and fails to recover the 5-day moving average; the downside target is 8560. If 8560 is breached, the next target is 8450.
Signals for Reducing/Closing Positions: Closing price stabilizes above 8735, MACD histogram shortens, and RSI rises above 50.
Key Risk Warnings:
Negative Australian trade data: May saw the largest trade deficit in 10 years, with a sharp decline in iron ore and gold exports, continuing to suppress resource-heavy stocks and dragging down index elasticity;
RBA interest rate expectations: High inflation resilience has led the market to postpone expectations of rate cuts, and high interest rates continue to suppress the real estate and technology growth sectors;
A decisive break below 8600 (below the daily close) would widen the medium-term correction space, with downside targets at 8560→8450, shifting the trend from consolidation to a deep correction;
Geopolitical conflicts and sudden changes in Sino-Australian trade policies could cause a sharp drop in commodity prices in a single day, leading to a rapid decline in the index;
New Zealand 50 Index (NZX50)
Basic Market Overview:
The New Zealand Stock Exchange 50 Index fell 28 points, or 0.2%, to close at 13,582 on Thursday, continuing the previous trading day’s decline, mainly affected by the communications services, energy, consumer goods, and technology sectors. Telecommunications services fell 2.8%, with Spark New Zealand, New Zealand’s largest telecommunications and digital services company, plunging 3.7%, while Chorus, New Zealand’s largest telecommunications network operator, fell 2.5%. Broader indices followed Wall Street’s decline as traders reassessed the sustainability of the AI-driven rally. Traders expect New Zealand’s May consumer spending data to be released on Friday. However, a pullback in oil prices helped limit losses as inflation concerns eased, reducing expectations of interest rate hikes. On the data front, New Zealand’s building permits fell 4.0% in May.
Sector Performance:
Leading Sectors:
Leading Sectors (Only a few sectors closed higher today)
The overall market was weak today, with no sectors showing significant gains. Only finance and banking, aged care real estate, and a small number of infrastructure stocks showed slight resilience and closed higher:
Banking and Financials: ANZ and Westpac New Zealand branches closed slightly higher, with expectations of interest rate cuts supporting the defensive attributes of high-dividend banks.
Aging and Healthcare Real Estate: Ryman Healthcare and Summerset aged care communities bucked the trend with slight gains, as demand for aged care services provided stable cash flow.
Infrastructure/Construction: Port and power infrastructure stocks, heavily weighted in the sector, showed resilience despite fluctuations, with declines significantly smaller than those in telecommunications and consumer goods.
Leading Declines:
Leading Declines Sectors (Drag Down the Overall Market):
Telecommunications Services (Down 2.8%, Weakest Sector in the Market): Heavyweight stocks: Spark New Zealand -3.7%, Chorus -2.5%. The collective weakness of telecom operators was the biggest drag on the index.
Energy Sector: Falling international crude oil prices suppressed earnings expectations for energy stocks, leading to a decline.
Consumer Staples: Leading stock A2 Milk fell 1.3%, and pharmaceutical distributor Ebos Group plunged 2.7%, indicating weakness in the consumer/healthcare sector.
Technology & Software Sector: Following the pullback in the US AI sector, local software and digital stocks generally declined.
Secondary Drags: Industrial transportation and utilities saw slight declines; Freightways freight fell 1.6%, and Auckland Airport fell 0.9%.
Technical Analysis:
The NZX50 New Zealand 50 Index closed at 13,582 points on Thursday, down 28 points, or 0.2%, marking its second consecutive day of decline. This followed overnight weakness in US stocks, with the telecommunications, utilities, and consumer sectors collectively dragging down the market. The index is heavily weighted towards defensive sectors such as utilities, infrastructure, and healthcare, making it highly sensitive to interest rate fluctuations. On Thursday, the sharp declines in Spark and Chorus telecom stocks led the decline, dragging down the index, while growth stocks lacked support. Weak building permit data suppressed sentiment in the real estate and logistics sectors, with only low oil prices slightly offsetting the decline. Regarding the candlestick pattern: the NZX50 has formed two consecutive small bearish candles, a mild correction without a significant drop in volume, indicating a passive adjustment driven by cooling risk appetite in US stocks, with no major negative factors in the domestic fundamentals. Technical Indicators: RSI (14): Falls back to the 52 range, out of overbought territory, neutral to slightly weak, not yet oversold, and the pullback may continue; MACD: The daily red bars continue to narrow, and the fast and slow lines show signs of a death cross, indicating weakening bullish momentum.
Trading Strategy:
Buy on dips (main strategy, overall bullish trend remains unchanged)
Entry conditions: Price retraces to 13540-13550 and stabilizes, 4-hour chart shows a positive candle, and trading volume shrinks;
Stop-loss: Exit if the price breaks below 13495 (20-day moving average), with a stop-loss range of approximately 87 points;
Tiered profit-taking: First profit-taking: 13640-13650 (short-term resistance level, reduce position by 50%); Second profit-taking: 13740 (yearly high, exit all positions)
Logic: The medium-term moving averages remain bullish, the pullback is a technical correction, and the interest rate cut cycle is a long-term positive for utilities and real estate stocks.
Short-term bearish strategy (light position, ultra-short-term, only for pullbacks)
Entry conditions: Rebound to 13640-13650 encountering resistance; 4-hour chart showing a stalling bearish candlestick.
Stop-loss: Stop loss at 13680, 48 points.
Profit target: 13550 (first support); extreme downside target 13490.
Risk management restrictions: Short positions are only suitable for quick intraday trading; long-term holding is not advisable. The risk-reward ratio for short positions is low within a bullish overall market environment.
Risk Warnings:
New Zealand Domestic Consumption Data (May Consumer Expenditure to be released on Friday): If the data significantly misses expectations, the market will lower its expectations for interest rate cuts, putting significant pressure on utilities and REITs, and the NZX50 will deeply test the 13495 support level;
New Zealand Inflation Rebound Risk: Rising oil and food prices will limit the central bank’s ability to cut interest rates, suppressing the valuation of high-dividend defensive sectors;
US tech stocks continue to correct, global risk appetite is declining, and foreign capital is flowing out of New Zealand defensive assets;
Weak Liquidity: Compared to US and Australian stocks, the NZX50 has lower trading volume, making it prone to slippage when breaking through key levels, and stop-loss orders are easily triggered.
Disclaimer: The information contained herein (1) is proprietary to BCR and/or its content providers; (2) may not be copied or distributed; (3) is not warranted to be accurate, complete or timely; and, (4) does not constitute advice or a recommendation by BCR or its content providers in respect of the investment in financial instruments. Neither BCR or its content providers are responsible for any damages or losses arising from any use of this information. Past performance is no guarantee of future results.

Comments
No comments yet. Be the first to share your thoughts!
Authentication Required
You must be logged in to post a comment.