Daily Analysis 2 July 2026 | Strong Dollar Pressures Gold While Oil Finds Stability

Currency & Commodity Analysis:
US Dollar Index
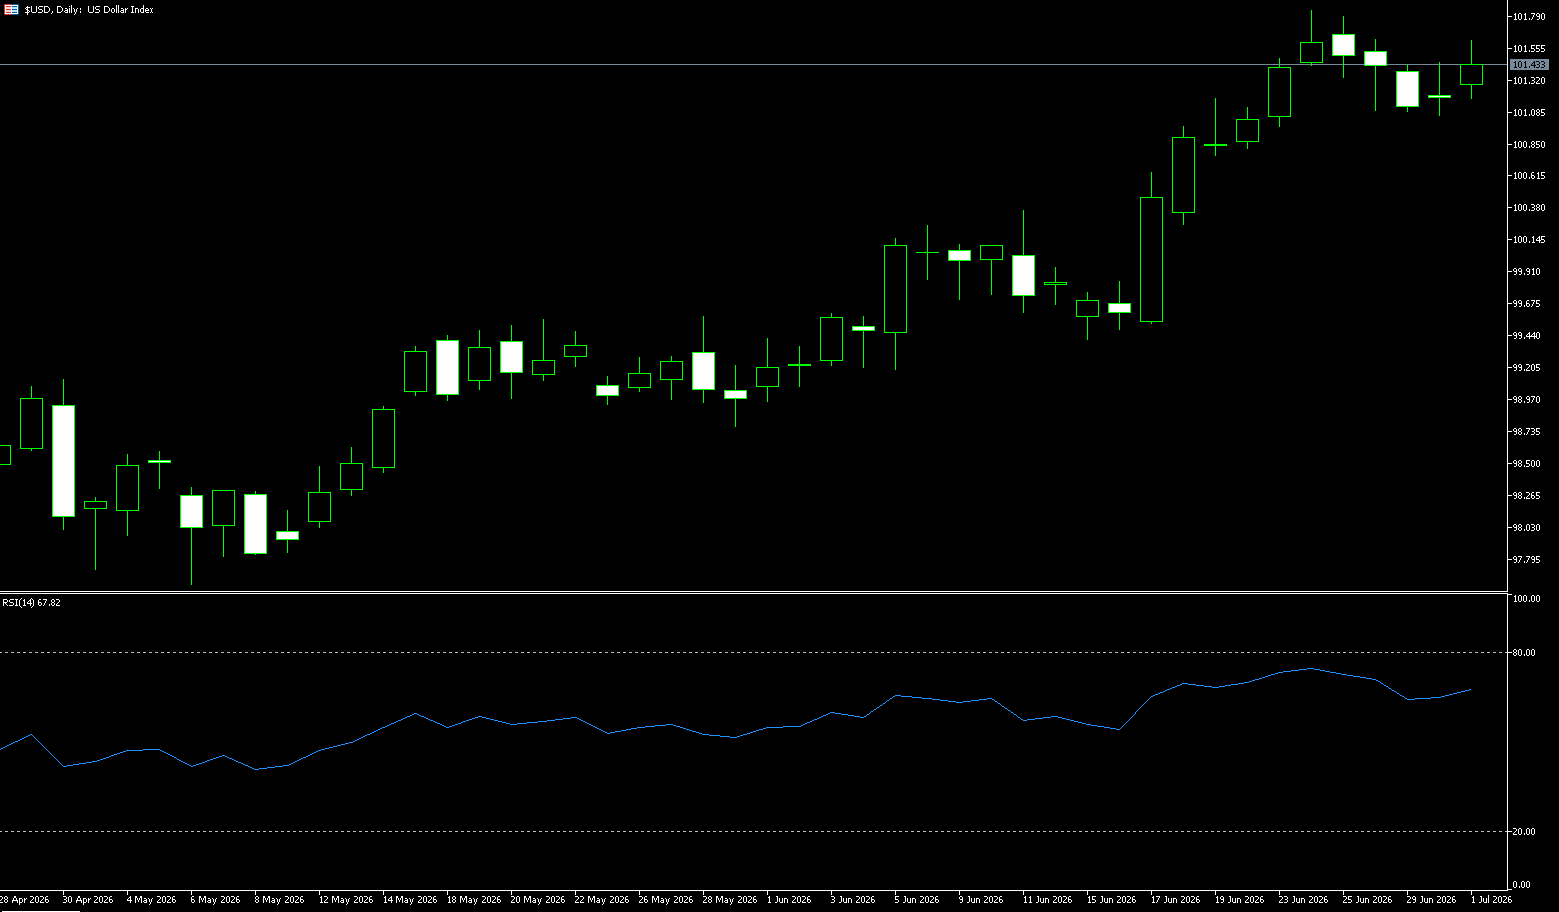
The strengthening US dollar pushed the yen to its lowest level since 1986. The USD/JPY pair rose to 162.78 at one point, marking its fourth consecutive quarterly gain, the longest winning streak in four years. This was mainly due to the market increasingly pricing in a Fed rate hike – federal funds futures indicate a 65% probability of a September rate hike, coupled with strong US economic performance and inflation well above target, while Japanese interest rates remain significantly lower than US rates, resulting in a large yield gap that continues to benefit the dollar and sustain carry trades. The market is awaiting Thursday’s US June jobs report (expected to show 110,000 new jobs and a 4.3% unemployment rate), while most US markets will be closed on Friday for Independence Day. Reduced liquidity could provide an opportunity to disrupt speculative short positions. Morgan Stanley believes the market’s expectations for the Fed are too aggressive, predicting US inflation will be lower than official forecasts, thus reducing the likelihood of rate hikes. The current rebound in the US dollar index is not solely driven by safe-haven demand. The more crucial factor is the repricing of short-term interest rate expectations, coupled with the weakening of heavyweight currencies such as the euro and yen, keeping the index near its year-to-date highs.
The dollar is partly traded based on yield and partly on confidence in the institution’s credibility. Political intervention does not necessarily negatively impact the dollar, but it makes trading less pure. This narrows the path for the dollar index’s rise. Strong data, a hawkish Warsh, and a halt in oil price declines could still push the index above 102.0. However, the risk-reward ratio becomes less attractive. The dollar has already absorbed a significant amount of optimism. From now on, abandoning the pursuit of a new dollar rally seems more appealing than chasing the rally. The first support level to watch is 101 (a psychological level); a break below this level would test 100.53 (the 20-day moving average). On the upside, if the US dollar index rises above 101.39 (the beginning of the week’s high), the next targets will be 101.80 (last week’s high) and 102.00 (a psychological level).
Consider shorting the US dollar index today at 101.50, with a stop-loss at 101.60 and targets at 101.05 and 101.00.
WTI Crude Oil
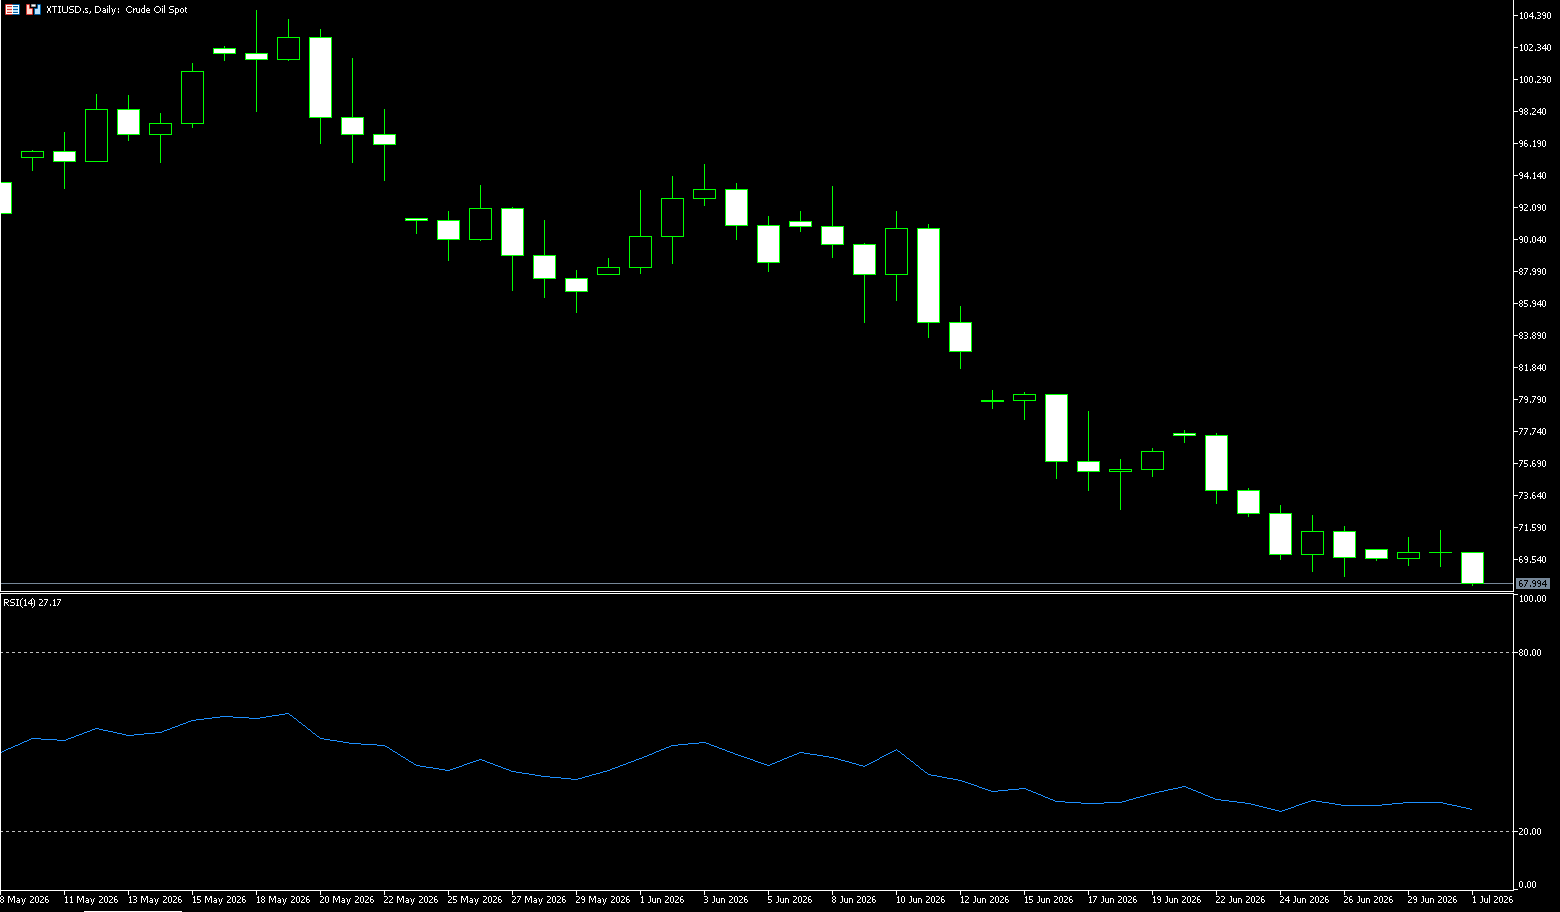
On Wednesday, crude oil prices stabilized near $69 a barrel after recording their steepest quarterly decline since 2020, as investors awaited the latest developments in peace talks between the US and Iran in Doha, both hoping to ease tensions in the Strait of Hormuz following recent clashes. Washington and Tehran are working towards a lasting solution to the conflict, although Iran continues to insist on controlling maritime traffic in this strategic waterway. Meanwhile, tanker traffic continued to recover, with cargo shipments increasing as the US and Iran ceased fighting in the Strait of Hormuz. Analysts also warned that the risk of oversupply is looming due to a faster-than-expected rebound in exports, with Iran saying it has shipped more than 40 million barrels of oil since the US lifted its naval blockade, and Russian exports surging to record levels, leading to a sharp increase in barrelled oil at sea.
From the demand side, the US travel season is about to enter its peak, but the market believes that demand growth cannot fully offset the pressure of supply recovery, limiting the upward momentum of oil prices. Overall, oil prices are undergoing a rebalancing process of “rapidly receding geopolitical premiums + accelerated supply recovery + limited seasonal demand support,” resulting in a significantly narrower market volatility structure. From a daily chart perspective, after a rapid decline following the previous geopolitical shock, WTI crude oil has returned to its mid-term densely traded range, exhibiting a consolidation structure after a high-level pullback. A short-term equilibrium point has formed around $70, indicating that the market is rebuilding a new price center. Resistance is concentrated at $71.60 (the 9-day moving average) and the 200-day moving average area of $73.15. Failure to break through this area will continue to limit the rebound. Key support is located at $68.00 (a psychological level), which may be tested again. A break below this level could open up further downside potential to the $65 area.
Today, consider going long on crude oil at 67.85, with a stop loss at 67.68 and targets at 70.00 and 71.00.
Spot Gold
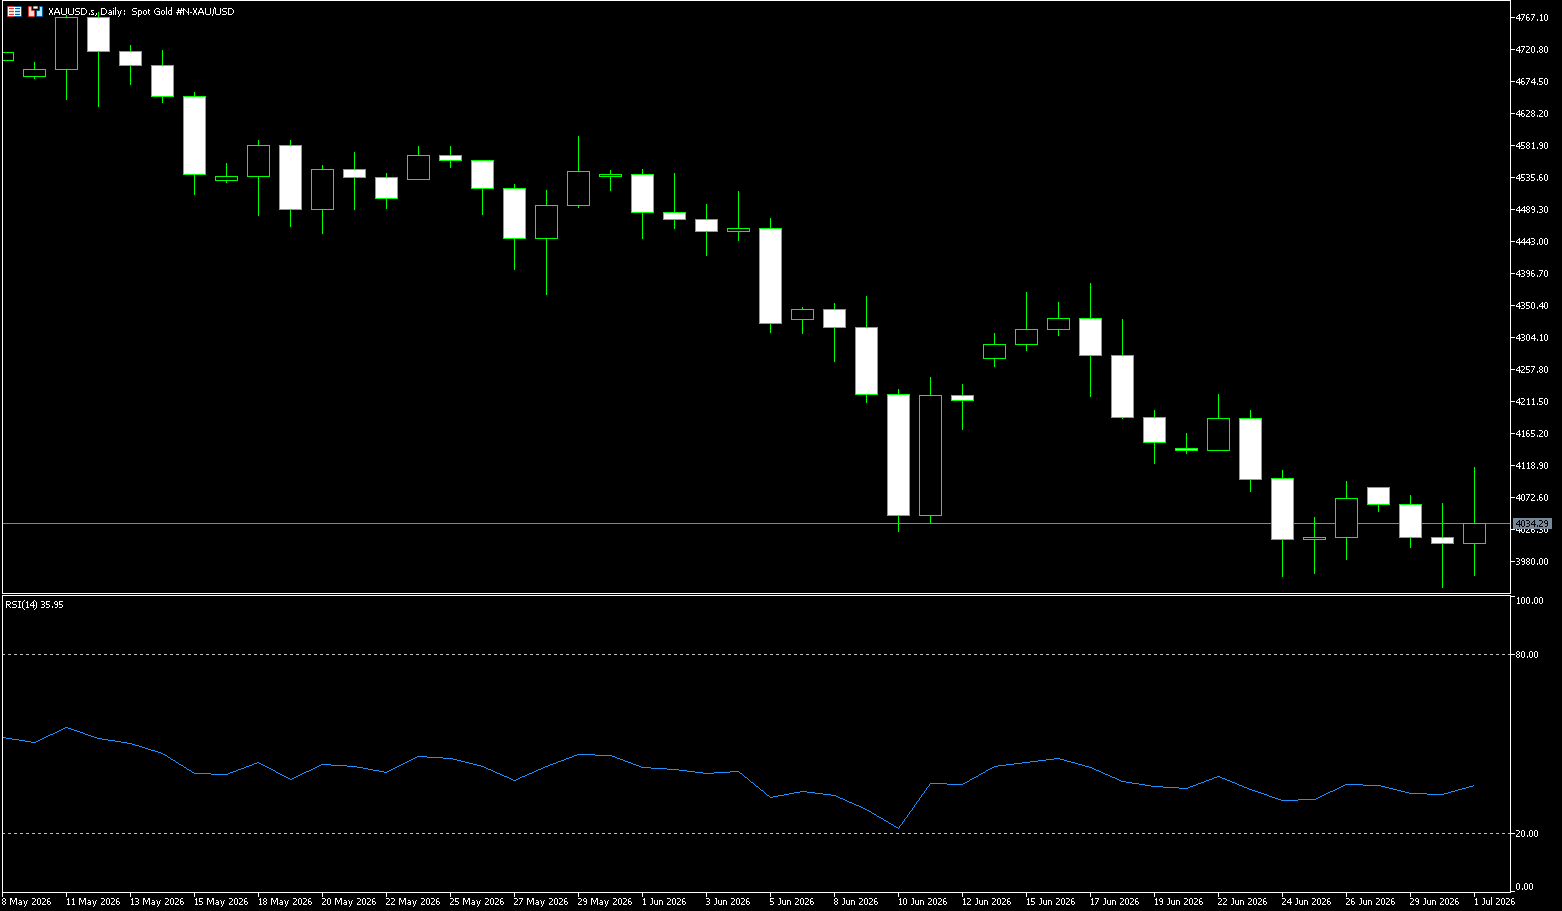
On Wednesday morning, spot gold traded above $4,000 per ounce, hovering around $4,030. Gold prices fell 11.2% in June, marking the largest quarterly decline since 2013 at 14.14% in the second quarter, and the first quarterly decline since 2024. Inflation concerns stemming from the Middle East conflict strengthened market expectations for further interest rate hikes by the Federal Reserve. The ADP and non-farm payroll data later this week will provide further guidance. Despite short-term pressure on gold prices, a survey by the Official Monetary and Financial Institutions Forum (OMFIF) indicates that central banks may reduce their dollar exposure and increase their gold holdings over the next decade due to geopolitical concerns. The Fed’s hawkish shift was the biggest driver of the more than 10% plunge in gold prices in the quarter. High inflation, expectations of interest rate hikes, and a strong dollar combined to push gold below $4,000, reaching a more than six-month low. Short-term non-farm payroll data will determine the next direction, but the long-term supporting logic of central bank gold purchases and debt risks remains intact. This most severe crash in 13 years is both a risk and a litmus test for long-term positioning.
If this week’s employment data is strong, it will further strengthen expectations of a Fed rate hike, and gold may face a new round of selling pressure. Conversely, if the data is weak, it may provide a breather for gold. From a technical perspective, gold is currently facing a severe test. Gold prices are trading significantly below the 50-day, 100-day, and 200-day simple moving averages, which are concentrated in the $4438 to $4663 range. The Relative Strength Index (RSI) is around 32.85, still in a weak zone; the Directional Movement Index (DPI) is at 42, indicating that the current downward trend remains strong. Even if gold prices rebound in the short term, the previous turning point high of $4,064 (the 5-day moving average) will be the first resistance level. The second is the $4,100 psychological level. Having broken below the $4,000 mark again, the recent multi-month low of $3,959 will become the next support level. A decisive break below this support would open up a steeper and more sustained downside to the $3,900 level.
Consider going long on gold today at $4,025, with a stop loss at $4,020 and targets at $4,080 and $4,070.
AUD/USD
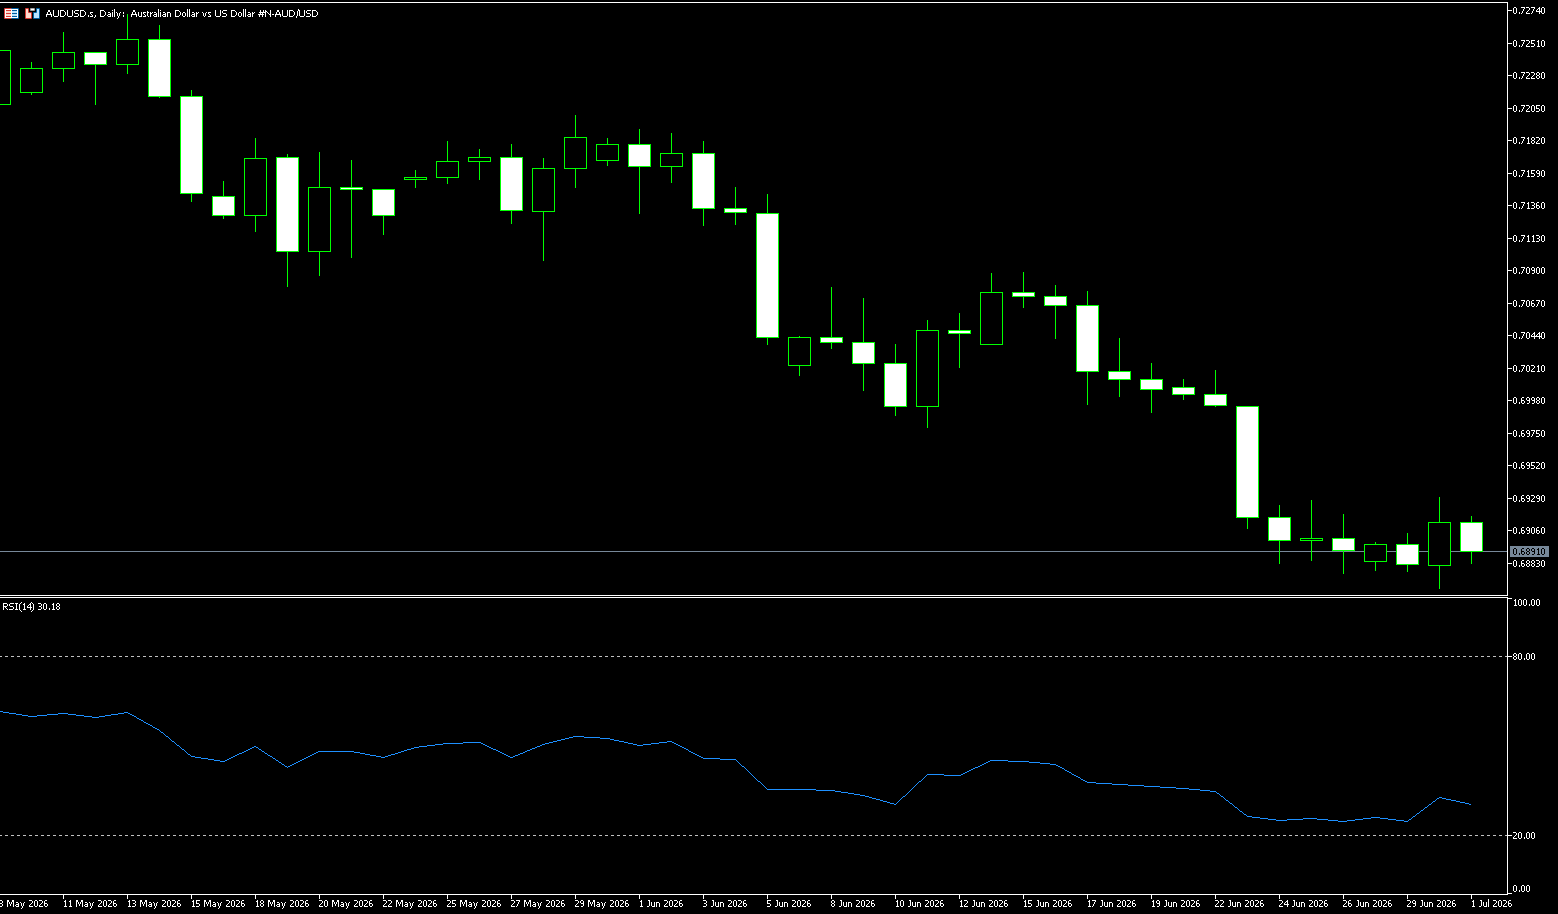
The AUD/USD pair struggled to capitalize on the previous day’s rebound from the 0.6865 area (a three-month low), encountering renewed selling pressure during Wednesday’s Asian session. China’s June manufacturing PMI fell to 51.7 from 52.2 in May. This followed Tuesday’s official PMI data showing barely any expansion in business activity last month, weighing on the Australian dollar, which acts as a proxy for China. The slight rise in the US dollar added downward pressure to the Australian dollar/US dollar pair. The Australian dollar further broke below US$0.6880, extending its decline to a three-month low, as the strong US dollar overshadowed the Reserve Bank of Australia’s (RBA) tightening policy stance. The minutes of the RBA’s June meeting showed that policymakers agreed that interest rates should remain tight to curb excess demand and restore inflation to the target level, even if economic growth slows. The board also stated that they were prepared to raise interest rates further if necessary, as developments in the Middle East continue to pose upside risks to inflation. Meanwhile, the Australian dollar continued to be pressured after the Federal Reserve adopted a more hawkish stance.
On the daily chart, the Australian dollar is trading at 0.6890 against the US dollar, with a short-term bearish bias as it remains capped below the 14-day simple moving average at 0.6967 and the psychological level of 0.7000. The pair is still trading above the 200-day simple moving average at 0.6863, which provides basic trend support, but the position suggests downside risks as prices remain below short- and medium-term moving averages. The Relative Strength Index (RSI) (14) is 32.25, slightly above the oversold zone, while the Average Directional Index (14) is approximately 40.7, indicating a relatively strong current trend, reinforcing the downward tone rather than a clear reversal signal. On the downside, recent support is at the 200-day simple moving average of 0.6863, followed by horizontal support at 0.6833; a break below this area would expose deeper support at the 0.6800 level (a psychological level).
Today, consider going long on the Australian dollar at 0.6880, with a stop-loss at 0.6870 and targets at 0.6945 and 0.6940.
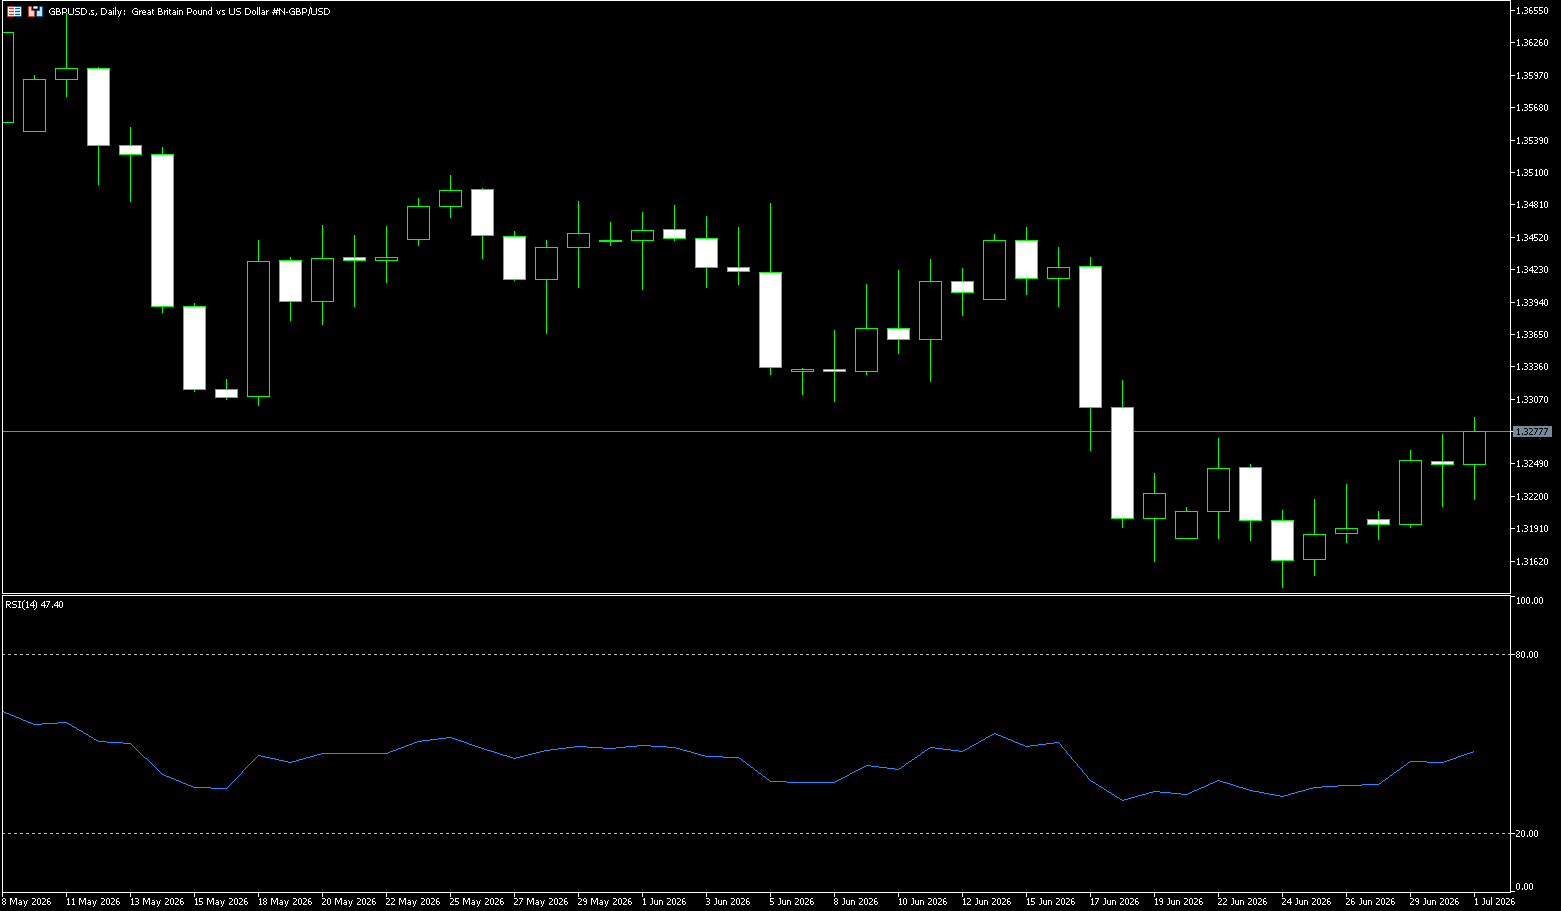
GBP/USD
GBP/USD hit a long-term low last week, but rebounded this week. It is currently impossible to determine whether this break is trend-determining. In the forex market, price breakouts are often difficult to discern, and trends frequently lack continuity and are hard to capture. However, historically, this currency pair has shown relatively stronger trend continuity. It’s crucial to note that this round of decline was driven by hawkish signals from the Federal Reserve’s interest rate meeting. Such fundamental catalysts often have medium- to long-term guiding significance and can easily become the starting point for trend reversals or market reversals. After a prolonged period of sideways consolidation, the signals for GBP/USD are gradually becoming clearer, and the respective market logics of the pound and the dollar are becoming increasingly apparent, with the dollar remaining the core factor dominating the pair’s volatility.
First, let’s look at the US Dollar Index: The index reached a 13-month high last week, but retreated after encountering resistance at the 101.39 level. After two consecutive days of slight pullback, the price has rebounded again, and may retest this resistance level in the near future. If the US Dollar Index breaks through upwards effectively, even if the British pound maintains some resilience, GBP/USD will still be under pressure and decline. Switching to the GBP/USD chart, the overall structure this week is bullish, but the upward momentum is weak, and the sustainability of the trend is questionable. The chart has already shown a pattern of higher lows, which is a bullish technical signal, and the psychological level of 1.3200 has formed a stepped support range. Whether this support level holds will be the key watershed for the pair’s movement today: if the support is broken, the downtrend will resume and refresh the low to 1.3140 (the low of June 24th). If the 1.32 support holds, the price will rise again; the target is 1.3301 (the 20-day simple moving average) and the 1.3350 area.
Today, consider going long on GBP at 1.3268, with a stop loss at 1.3258 and targets at 1.3330 and 1.3340.
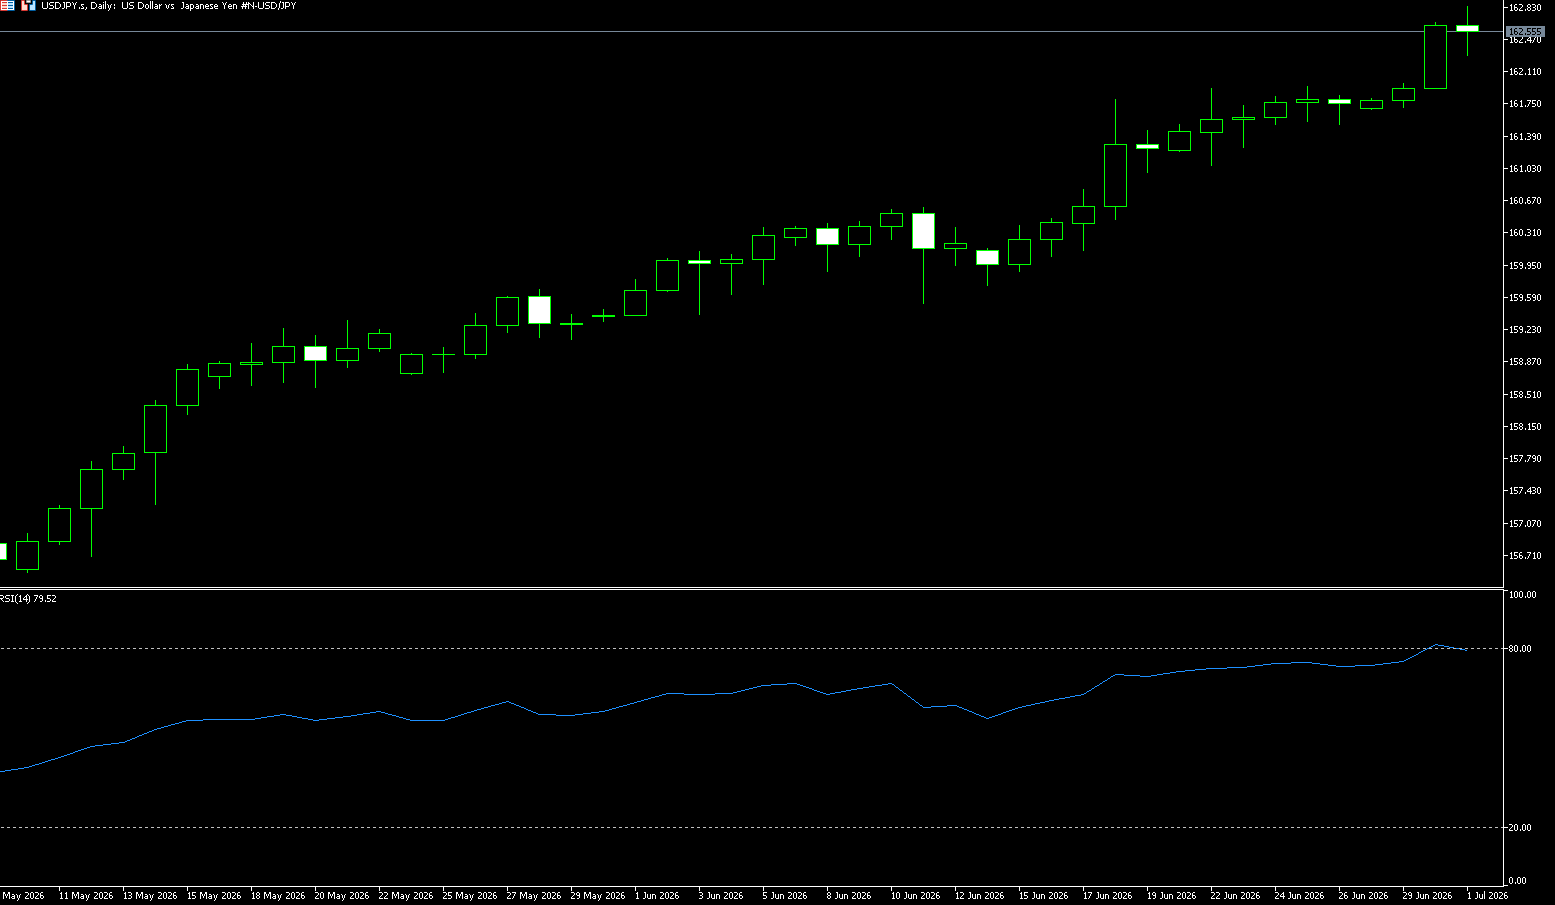
USD/JPY
USD/JPY gained new buying interest during Wednesday’s Asian session, rising to just below 163.00 and testing a new 40-year high. The wide interest rate and real yield differential between Japan and the US continues to drive carry trades, weakening the yen. The dollar benefited from US-Iran uncertainty and hawkish Fed expectations, pushing the pair higher. Meanwhile, new dollar buying halted the dollar’s decline from its May 2025 high. Increased geopolitical tensions between the US and Iran exacerbated market inflation concerns, further raising expectations of a Fed rate hike; traders widely bet on a possible Fed rate hike this year, supporting the dollar and driving USD/JPY higher. Multiple bullish fundamentals for the dollar significantly reduced market expectations of renewed Japanese government intervention to support the yen. Even with the Bank of Japan’s hawkish stance, it failed to boost confidence among yen bulls, and the upside potential for USD/JPY remains. The minutes of the Bank of Japan’s June policy meeting showed that officials focused on the persistently rising inflation risk, with some calling for a faster pace of interest rate hikes to bring rates to the neutral range for the economy. While the current state of rising inflation in Japan provides justification for the central bank’s tightening policy, it is unlikely to reverse the yen’s weakness.
This week, several key data releases and speeches will guide the subsequent trends of US Treasury bonds and the US dollar, thus affecting USD/JPY: On Wednesday, Federal Reserve Chairman Kevin Walsh will speak at the European Central Bank’s Sintracht Frankfurt Forum, and on Thursday, the US non-farm payroll data will be released, both providing key signals about the outlook for US interest rates. USD/JPY broke through the upper trendline of an ascending wedge on the daily chart, reaching a 40-year high of 162.78, completely invalidating the previously predicted reversal pattern. Multi-period RSI indicators have simultaneously entered overbought territory, suggesting that the pair will likely consolidate in the short term before attempting another upward move. The short-term upside target for bulls is 165, with the key medium- to long-term resistance level at 170. The first short-term support level is 161.88 (9-day simple moving average), followed by the psychological level of 161.00. A break below this level would target 160.00 (a psychological level).
Consider shorting the US dollar at 162.70 today, with a stop-loss at 162.85 and targets at 161.90 and 161.80.
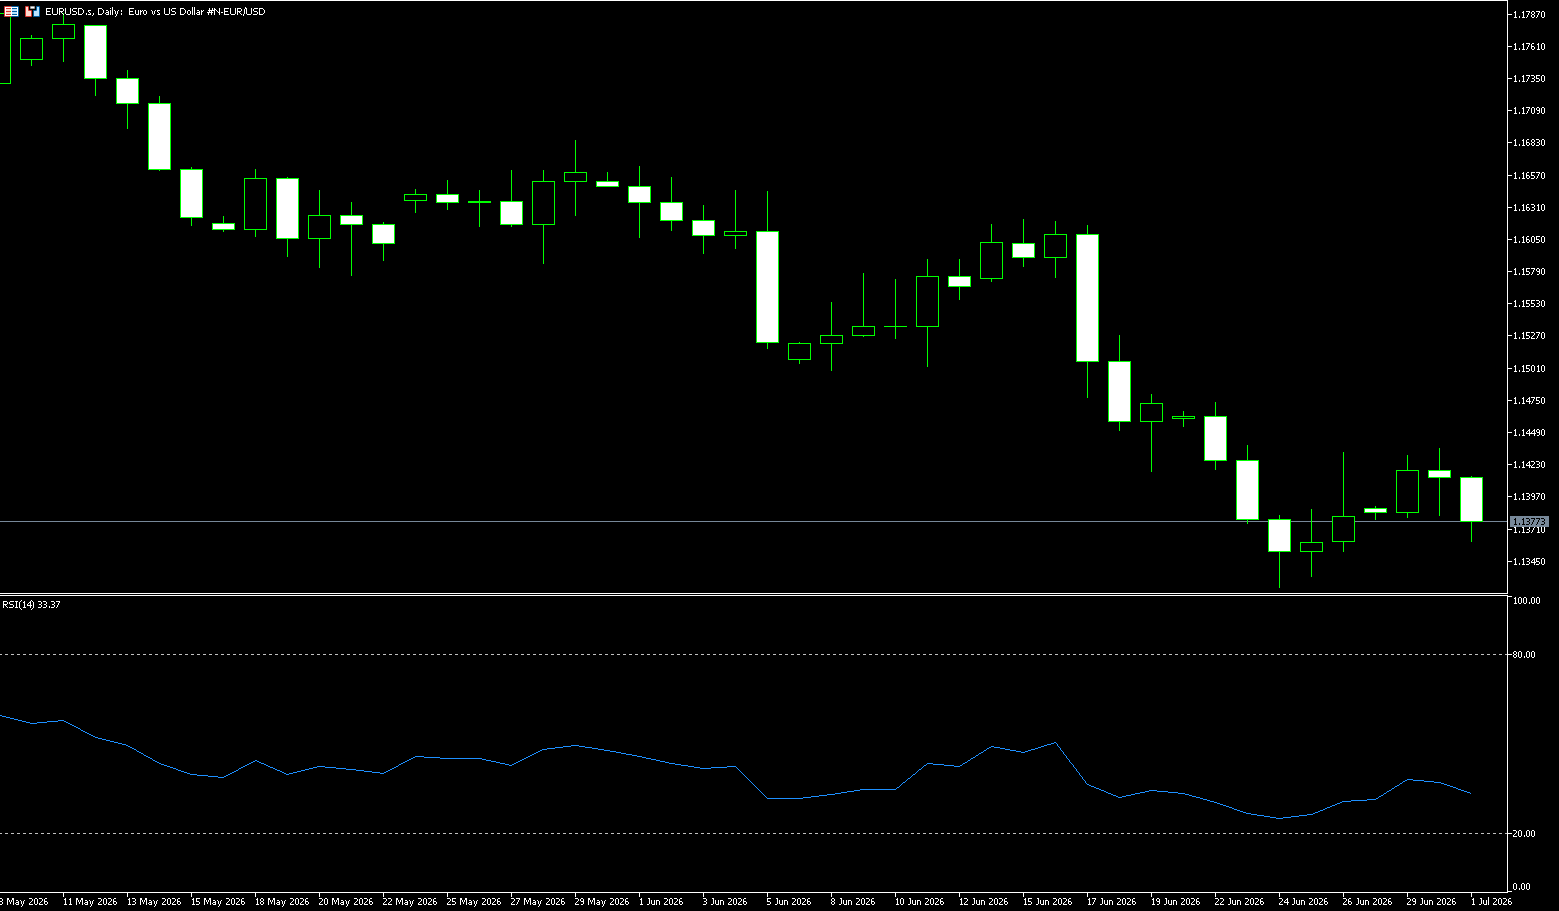
EUR/USD
The euro/dollar pair lost momentum in early Asian trading on Wednesday, falling near 1.1400 as bets on aggressive tightening by the European Central Bank (ECB) diminished. Signs of easing price pressures in major European economies such as Germany, France, and Italy reduced expectations of restrictive ECB policies, weighing on the euro against the dollar. Data released Tuesday by the Federal Statistical Office (Destatis) showed that Germany’s consumer price index (CPI) inflation rate fell to 2.3% in June, down from 2.6% in May and below market expectations of 2.5%. Unless oil prices experience a dramatic rebound before the meeting, it is almost certain that the European Central Bank (ECB) will hold rates steady in July. ECB President Christine Lagarde stated last week that there was no need for “strong” action, citing falling energy prices and the lack of “second-hand effects” that could further push up inflation, such as higher wage demands. On the other hand, the Federal Reserve maintained its benchmark interest rate within the target range of 3.50% to 3.75% at its June policy meeting. The central bank’s latest statement also removed any hints of future rate cuts.
From a fundamental perspective, the renewed support for the US dollar index is one of the core factors contributing to the weakness of the euro/dollar. Amid renewed geopolitical risks, market demand for the safe-haven dollar has rebounded. Simultaneously, market expectations that the Fed will maintain high interest rates or even further raise them continue to ferment, keeping dollar assets highly attractive and exerting sustained downward pressure on the euro. From a daily chart perspective, the exchange rate maintains an overall medium-term bearish consolidation pattern, with rebounds seen more as corrective movements than trend reversals. The key support level is currently around 1.1324 (the low of June 24th). A break below this level would see the 1.1300 level become the next key support and a key dividing line between bullish and bearish sentiment. A further drop below this level could trigger a deeper continuation of the downtrend. Resistance is concentrated at 1.1455 (the 14-day moving average), followed by the psychological level of 1.1500 and the 200-period moving average area at 1.1538, which forms the current main resistance zone for any rebound.
Consider going long on the Euro at 1.1370 today, with a stop loss at 1.1360 and targets at 1.1420 and 1.1430.
Stock Analysis:
Australian ASX 200 Stock Index
Basic Market Overview:
The Australian ASX 200 index fell 56 points, or 0.6%, to close at 8723 on Wednesday, the first day of the new financial year. The market extended its decline from the previous day due to a sharp drop in US stock index futures, following a strong Wall Street rally in the first half of 2026, supported by a continued surge in chip stocks. The market remained cautious ahead of Thursday’s May trade data, which showed a modest surplus in April as exports exceeded imports. Meanwhile, building permits declined for the third consecutive month in May, marking the fourth contraction this year. In its June meeting minutes, the central bank indicated that further tightening of policy remained possible after three rate hikes since January, due to rising cost pressures in the second quarter.
Sector Performance:
Leading Sectors
Energy (XEJ): Relatively Resilient Woodside Energy (WDS)
Crude oil prices rose slightly, and the market is optimistic about the energy demand outlook.
Healthcare (XHJ): Slightly Up Colliers (COH)
Defensive sectors are favored as investors avoid risky assets.
Consumer Staples (XSJ): Slightly Up Woolworths (WOW)
Demand for consumer staples remains relatively stable amid inflationary pressures.
Leading Sectors
Retail Trade/Consumer Discretionary (XDJ): Coles Group (COL)
The Federal Fair Work Commission’s 4.75% pay rise decision was higher than expected, increasing labor cost pressures on retailers.
Business Services: Wesfarmers (WES)
Concerns about slowing economic growth have weakened business activity expectations.
Utilities (XUJ); Australian Energy (AGL)
Rising interest rate expectations have reduced the attractiveness of the utilities sector as a bond proxy asset.
Technical Analysis
The Australian ASX 200 index closed at 8722.9 points today, down 0.6% for the day, with an intraday range of 8692-8746. The index rallied throughout the day before retreating, closing with a bearish engulfing pattern, indicating pressure on the bulls and a short-term shift to a weak, volatile pattern. The RSI is at 41, having fallen into the neutral-to-bearish zone but not yet oversold; the MACD histogram is shortening, and the fast line is turning downwards, indicating increasing bearish momentum; trading volume is moderately increasing, with selling pressure continuing to ease. The index has fallen below the 20-day moving average at 8750, and the 5-day moving average has crossed below the 20-day moving average, forming a short-term death cross; the 50-day moving average at 8670 is a key medium-term support/resistance level, and the index is currently in a resistance zone.
Trading Strategies:
The following are technical trading ideas only and do not constitute investment advice. Leveraged trading may result in losses exceeding the principal.
Long Position Strategy:
Buy on dips (only for oversold rebounds, small position size)
Enter only when the price quickly drops to the 8670-8690 range, and a bullish hammer/piercing pattern appears on the hourly chart, and the RSI falls below 30.
• Entry: Stabilization signal appears near 8680
• Stop Loss: 8668 (If it breaks below the 50-day moving average, the trend turns bearish, abandon the long position)
• Take Profit: 8725-8735, exit immediately upon reaching the resistance level, do not hold.
Short Position Strategy:
Follow the trend (main strategy, aligning with the weak trend of the day)
• Entry: Rebound to 8735-8745 and encounter resistance, a bearish engulfing/shooting star pattern appears on the hourly chart, and the RSI returns above 60 and turns downwards.
• Stop Loss: 8758 (23 points above the intraday high, breaking the short-term downtrend structure)
• First Take Profit: 8700 (near the intraday low)
• Second Take Profit: 8690; if it breaks below 8690 with significant volume, look for 8670
• Exit Rules: Close all positions upon reaching the take profit target; do not hold overnight to avoid the risk of overnight volatility in US stocks
Key Risk Warnings:
External Macroeconomic Risks
Significant overnight volatility in the Nasdaq/S&P 500, a jump in US Treasury yields, and a strengthening AUD/USD will suppress export-oriented mining stocks and drag down the ASX200; US economic data released tonight will significantly impact the opening gap of Australian stocks the following day.
Sector Hedging Risks
Strong gold and copper prices can only provide slight support to the index. When banking and healthcare stocks decline, the index is prone to unilateral weakness. Do not rely solely on resource stocks to judge the market.
Technical Breakdown Risk
8670 is the mid-term support level. A decisive break below this level would open up further downside potential, and bottom-fishing against the trend is prohibited. Only a move above 8750 would signal the end of the correction and a return to an upward trend.
China Shanghai Composite Stock Index
Basic Market Overview:
The Shanghai Composite Index rose 0.44% on Wednesday to close at 4,112 points, while the Shenzhen Component Index fell 0.53% to 16,119 points, as concerns about uneven economic growth weighed on market sentiment. Goldman Sachs stated that discussions with Chinese investors revealed growing caution regarding the country’s short-term growth prospects, noting a more uneven recovery characterized by weak consumer confidence, labor market pressures, and a persistent housing slump. Meanwhile, President Xi Jinping pledged to steadily advance “high-quality development,” emphasizing sustainable, innovation-driven growth. On the economic front, a private survey showed that China’s manufacturing PMI fell to a three-month low of 51.7 in June from 51.8 in May.
Sector Performance:
Leading Gains:
Financial Sector (Main Theme Leading Gains, Securities/Insurance Strongest)
Securities Sector: Net inflow of 5.92 billion yuan throughout the day; Huaan Securities, Tianfeng Securities, and Guosheng Securities hit the daily limit, Changjiang Securities briefly hit the limit; easing liquidity across the quarter and increased market trading volume catalyzed valuation repair for securities firms.
Insurance/Life Insurance: Sector gains nearly 10%, Xinhua Insurance surged over 7%, clear logic for low-priced heavyweight stocks to catch up.
Agriculture, Forestry, and Animal Husbandry (Collective Surge)
Pork, broiler, and poultry farming all surged; New Hope, Aonong Biotechnology, Yisheng Shares, and Xiangjia Shares hit the daily limit; pig cycle expectations are recovering, and funds are buying on dips in low-priced lagging stocks.
Pharmaceuticals, In-Vitro Diagnostics
Afternoon funds continued to drive up prices; Hainan Haiyao hit the daily limit for 5 out of 7 days, Minova and Huiyu Pharmaceutical also hit the daily limit, low-priced pharmaceutical valuations are recovering.
Real Estate, Multimodal Transport Logistics, Education
Low-priced and undervalued sectors rotated for catch-up gains, with small and medium-sized real estate stocks rising over 6%.
Leading Losers:
Optical Communication / CPO: Net outflow of 24.6 billion yuan, Quick Intelligent hit the daily limit down, optical fiber and optical modules suffered across-the-board declines.
Semiconductors, PCBs, and Memory Chips: Total outflow exceeding 23 billion yuan, Jiangbolong and Zhongwei Semiconductor plummeted.
Photovoltaics / Inverters: Sungrow Power fell nearly 14%, energy storage, liquid cooling, and computing hardware also saw a pullback.
Laser Equipment, Rare Earths, and AI Hardware weakened; short-term gains were huge, and shares were crowded, with funds shifting to low-priced, undervalued heavyweight stocks and agriculture and pharmaceuticals.
Technical Analysis:
Shanghai Composite Index closed today at 4112.45 points, +0.44%; the highest point of the day was 4143.31, and the lowest was 4087.54; the Shanghai market turnover was 1.6985 trillion yuan, and the total turnover of the two markets was 3.66 trillion yuan, an increase of 386.3 billion yuan compared to yesterday. July started strong, with Shanghai outperforming Shenzhen, and most stocks rose by 4300 yuan. Since the low of 3992, the market has been in a volatile rebound channel, currently within the mid-rebound range of 4065-4140. Today, it rose to 4143 before encountering resistance and falling back, closing with a bullish candlestick with an upper shadow, indicating a short-term consolidation phase at the upper edge of the range. The daily MACD is above the zero line, with the green bars continuously shortening and the DIFF turning upwards, suggesting a recovery in rebound momentum. The KDJ has entered a neutral-to-bullish zone, not yet extremely overbought, and still has some upward momentum, but there is a risk of a pullback due to indicator divergence above 4140. Short-term range: Support at 4100, strong support at 4085; first resistance at 4130. Intraday structure: The market opened with high volume, reaching 4143, but profit-taking in the technology sector in the afternoon dragged the index down. Large financial, pharmaceutical, and cyclical sectors at lower levels provided support, creating a typical divergence pattern of high-level sector selling and low-level heavyweight stocks buying.
Trading Strategies:
Long Strategy (Two Entry Modes)
Buy on Dips (Conservative, Prioritized)
Entry Conditions: Index retraces to around 4100 and stabilizes intraday, with trading volume not rapidly shrinking;
Sector Allocation: Brokerages, Pharmaceuticals, Undervalued Cyclicals, Industrial Semiconductor Equipment;
Profit Take: Reduce positions in batches between 4130 and 4140;
Stop Loss: If the index breaks below 4085 (closing price or 30-minute chart holds below), reduce positions unconditionally to mitigate risk.
Short Hedging Strategy (Executed After Index Surges)
If any of the three signals appear in the 4140-4150 range, take profits on high-flying themes in batches:
Continuously shrinking intraday volume, long upper shadow;
Significant net outflow of funds from high-flying technology sectors;
60-minute KDJ shows a bearish divergence and turns downward; After reducing positions, shift funds to low-flying defensive sectors, avoiding blindly going to cash.
Risk Warning:
Capital rotation is extremely rapid; today’s leading sectors are prone to divergence the following day. Overnight heavy investment in a single theme is strictly prohibited.
Capital continues to flow out of high-flying technology stocks, posing a risk of continuous short-term pullbacks. Avoid bottom-fishing.
The Shanghai Composite Index faces significant resistance at 4133 points. Without sustained volume, it will likely remain range-bound between 4070 and 4133, with limited upside potential.
Disclaimer: The information contained herein (1) is proprietary to BCR and/or its content providers; (2) may not be copied or distributed; (3) is not warranted to be accurate, complete or timely; and, (4) does not constitute advice or a recommendation by BCR or its content providers in respect of the investment in financial instruments. Neither BCR or its content providers are responsible for any damages or losses arising from any use of this information. Past performance is no guarantee of future results.

Comments
No comments yet. Be the first to share your thoughts!
Authentication Required
You must be logged in to post a comment.