

Asian Session | Friday 26 June 2026 The Yen Just Hit a 40-Year Low. Tokyo CPI Came In Hot. And Asia’s Tech Selloff Didn’t Stop for Micron
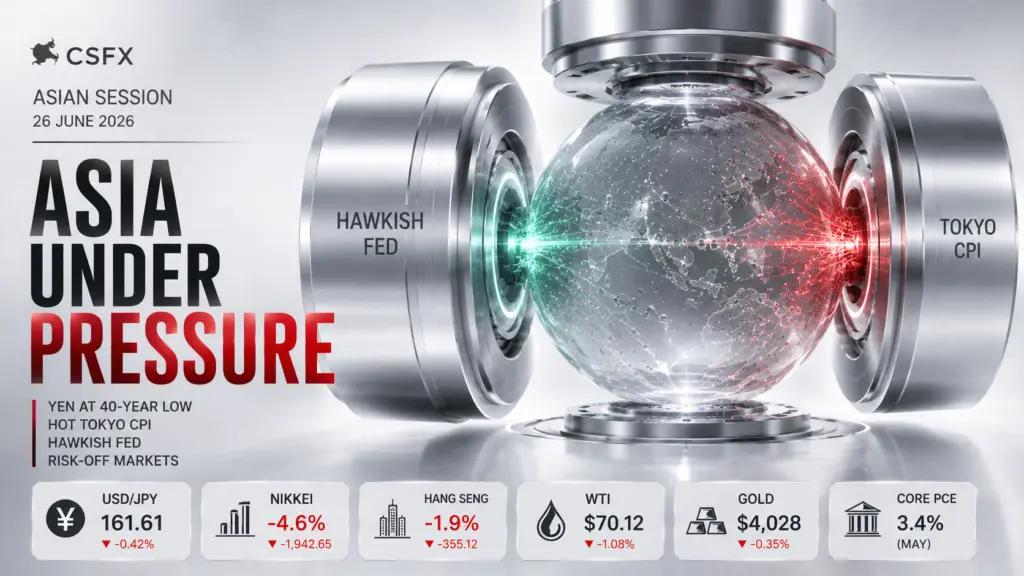
USD/JPY at 161.61, just below 162.00 — a 40-year yen low with intervention watch live. Tokyo headline CPI 1.7% YoY, core 1.6% — data that should be yen-bullish but isn’t. Nikkei -4.6% below 69,000. Hang Seng -1.9% at 22,648. Nasdaq futures -1.6%. Gold eyeing a fourth straight weekly loss. XRP at $1.00 — the psychological pivot after $1.48B in liquidations.
LIVE INTERVENTION WATCH: USD/JPY 161.61 — one tick from 162.00, the level MoF has historically defended with capital.
The most counterintuitive fact of Friday’s Asian session is that Tokyo’s June CPI print — headline at 1.7% year-on-year, core at 1.6% — is being treated as bullish for the yen’s structural case and simultaneously bearish for the yen’s immediate price. That paradox needs unpacking because it defines the session’s entire analytical architecture. Hot Tokyo inflation hardens the case for the BoJ to hike again — perhaps as early as September — which is structurally yen-supportive over weeks and months. But in this morning’s session, with the Fed still at 3.50 to 3.75% and the DXY near a 13-month high at 101.6, the immediate read is simply: higher Japanese inflation means higher Japanese import costs, which means a weaker yen compounds faster, which is a reason for intervention rather than a reason for yen strength. The data and the price are telling different stories on different timescales.
Meanwhile, Asia’s tech selloff has deepened in a way that Micron’s genuinely historic earnings beat — $41.46 billion in revenue, $25.11 EPS, $50 billion Q4 guidance — has been entirely unable to arrest. The Nikkei 225 fell below 69,000, posting a decline of approximately 4.6%. The KOSPI triggered circuit-breakers for the second time this week. The Hang Seng is down 1.9% at 22,648. Nasdaq futures are pointing to a 1.6% decline for Friday’s US session. This is the market saying that even a record Micron quarter cannot override the fundamental repositioning happening in high-multiple technology names as the hawkish Fed reality — September hike at 63% probability — reasserts its grip on long-duration valuations.
The linking thread between the yen story and the tech selloff is the dollar. DXY at 101.6 — near its 13-month high — is simultaneously keeping USD/JPY elevated against Tokyo’s hot CPI signal, and providing the valuation headwind to high-multiple tech names whose discounted cash flow models become less favourable with every basis point of sustained elevated rates. The dollar is not just a currency story today. It is the macro force that explains the yen paradox and the Micron paradox simultaneously.
USD/JPY at 161.61: The Geometry of the 162.00 Handle
USD/JPY at 161.61 is sitting 39 ticks below the 162.00 handle that has become the most watched single level in global FX. The pair has been above 160 for eleven consecutive trading sessions. Finance Minister Katayama has spoken by phone with US Treasury Secretary Bessent. The Ministry of Finance’s April intervention — the largest quarterly yen defence since 2004 — is on the record. And yet USD/JPY at 161.61 is six pips above where it closed on Monday. The carry trade is winning every skirmish.
The analytical question is not whether Tokyo will intervene. The question is when. The window has narrowed to the same geometry every time: USD/JPY consolidating just below a round number that carries 40-year significance, Tokyo CPI hot enough to justify BoJ aggression, and a diplomatic call already on record. The 162.00 to 163.00 zone is where intervention becomes imminent rather than probable. At 161.61, it is probable. The asymmetric short from 161.80 to 162.00 — hard stop at 163.00, target 157.50 to 158.50 — remains the best-defined trade in global FX right now. The waiting is the trade. Not the entry timing.
Tokyo’s June CPI adds a second pressure layer. Headline at 1.7% YoY (from 1.3%) and core at 1.6% (from 1.1%) are both accelerating. The BoJ hiked to 1.00% on June 19 with the explicit intention of bringing real rates less negative. Tokyo CPI accelerating immediately after that hike — rather than after the anticipated lag — gives the BoJ a stronger empirical case for an earlier September follow-up than the market had been pricing. That forward hike expectation is the structural variable that, over months, will eventually close the Fed-BoJ gap. Today’s price is the carry trade expressing that the gap is still enormous. Both things are simultaneously true.
The Tech Rotation That Micron Couldn’t Stop
The question Thursday’s US session asked and Asia is answering on Friday: can a single earnings print, however extraordinary, override a sector-wide rotation out of high-multiple technology? Micron’s numbers — five consecutive quarterly revenue records, a 24.3% EPS beat, $50 billion Q4 guidance — were the strongest memory-chip quarter on record. And yet the Nasdaq fell 0.3% on Thursday. And on Friday morning, Nasdaq futures are pointing to a further 1.6% decline. The market is telling you something important: the AI chip story and the tech valuation story are different stories, and the market is currently repositioning for the valuation story.
The Nikkei’s 4.6% decline — taking it below 69,000 to approximately 68,990 — is the sharpest expression of this rotation in Asia because the Nikkei had been the primary beneficiary of AI chip enthusiasm during the run to 72,095 three weeks ago. The same AI infrastructure names that carried the index to all-time highs are now the names being sold fastest. The Hang Seng at 22,648 is a fresh 52-week low approaching 22,547 — the level that would be the decade’s lowest for the index — driven by a combination of the same tech rotation and China-specific property and regulatory headwinds that no Micron beat resolves. The Korea-specific angle is aluminium and memory: the KOSPI circuit-breaker was triggered again, partly from aluminium weakness at a three-month low of $3,150 per tonne as Gulf supply chains restore and Chinese and Indonesian output normalises.
AUD/JPY at 111.34 and the Carry Compression
AUD/JPY at 111.34 is approaching the 200-day moving average and represents the carry compression trade playing out from both ends simultaneously. The RBA held at 4.35% in June with a hawkish bias, but Australia’s May CPI printed 4.0% against a 4.4% expectation — a disinflationary surprise that took the RBA’s next hike further off the table and removed the interest rate support that had been structurally underpinning AUD. The BoJ hiked to 1.00% on June 19. The spread between the two central banks compressed from 335 basis points to 335 basis points — the RBA’s hold and the BoJ’s hike brought the gap to precisely the same level, which confirms the carry direction is unchanged but the pace of change is real.
The 200-day moving average around 110.50 to 111.00 is the structural support below current levels. A break of that level with volume would be the signal that the carry compression is doing structural work rather than temporary repositioning. The Hang Seng’s continuing decline below 22,648 is adding the risk-off AUD pressure on top of the carry compression — AUD is a commodity and risk currency that loses on multiple fronts when the Hang Seng is at decade lows.
Gold at $4,028 and Its Fourth Weekly Loss
Gold at $4,028 is tracking toward a fourth consecutive weekly decline — an unprecedented streak for the metal in the post-conflict period that began with the signing of the US-Iran MOU on June 19. The mechanism has not changed: DXY at 101.6, September hike at 63%, real yields elevated relative to the conflict-era peak. But $4,028 is approximately $42 above the $3,987 Wednesday low that briefly took gold below $4,000 for the first time in 2026. The structural bid — WGC 1,231 tonne Q1 demand, central bank diversification — is real and is currently providing a floor that prevents the fourth weekly loss from becoming a structural breakdown.
The relevant question for gold heading into the weekend is whether the PCE 3.4% print, the September hike at 63%, and the DXY near 101.6 constitute a regime that requires the gold structural floor to be tested. CSFX’s answer: the $3,800 to $3,900 zone is where the structural floor asserts itself cleanly. At $4,028, gold is 128 to 228 dollars above that zone. The fourth weekly loss is the war premium continuing to exit. The structural floor has not been tested and will not be at current levels. Patience is the correct posture.
XRP at $1.00: The Liquidation Scar
XRP at $1.00 is the psychological pivot that $1.48 billion in liquidations across the crypto complex this week has produced. The round number is not analytically significant in and of itself — round numbers are psychologically significant in markets, but they are not structural support levels in the same way that institutional bid zones or technical levels are. What is analytically significant is the $1.48 billion liquidation total: it means that the crypto positioning that existed at the start of the week has been largely cleared. Leverage has been washed out. What remains is the structural holder base — the institutions, the long-term accumulators, and the wallets that are not leveraged.
Solana at $67.91, below all key exponential moving averages, with RSI at a monthly low, is in the same position as XRP from a technical standpoint — washed-out positioning, cleared leverage, approaching structural accumulation zones. The Alpenglow upgrade narrative, the tokenised SPCX on Solana, the validator consensus at 98% — none of these have changed. The price has moved from them. That is the definition of an accumulation opportunity in a fundamentally sound asset.
Read Full Report: capitalstreetfx.com/market-analysis/daily-market-analysis/

Comments
No comments yet. Be the first to share your thoughts!
Authentication Required
You must be logged in to post a comment.