

The Market Must Fall Before the Renaissance Can Rise
Rise
Space. AI. Quantum. Three revolutions entering public markets simultaneously at the second-most expensive valuation in 145 years of recorded financial history.
Capital Street FX Research Desk | Seven Parts | 16 Trade Setups
Overview
This is not a daily briefing. It is an attempt to answer a single question with the full weight of the historical record behind it: when genuinely transformational technology meets an historically extreme market valuation, what happens next?
The week of June 12, 2026 produced three events that, taken together, represent the most concentrated moment of technology-meets-capital the markets have seen since late 1999. SpaceX listed on the Nasdaq as SPCX and within days was trading at 73 times annual revenue — a price-to-sales ratio that makes Amazon’s 1997 IPO look conservative. Anthropic filed its S-1 for an IPO targeting October 2026 at a private valuation of $965 billion, with $47 billion in annualised revenue and its first operating profit visible on the horizon. OpenAI filed its S-1 days later, valued at $852 billion, projecting losses of $25 to $27 billion in 2026 and positive cash flow not until 2030. And IonQ, a quantum computing company almost no one outside the technical field had heard of, reported first-quarter revenue growth of 755% year over year.
At the same moment, the Cyclically Adjusted Price-to-Earnings ratio — the CAPE, the valuation measure that strips out short-term earnings volatility and averages a decade of results — stood at 40.43. The second-highest reading in 145 years of data. The only time it was higher was December 1999, at 44.19. The Warren Buffett Indicator — total market capitalisation as a percentage of GDP — was 233.8%, an all-time record. The top ten companies in the S&P 500 represented 40% of the total index, also an all-time record. The last time these signals appeared together, the NASDAQ fell 78% and did not recover for fifteen years.
This report covers the full historical record of what happens when this combination of ingredients converges: genuine technological revolution meeting priced-for-perfection markets. It covers the five stages every technology revolution passes through, the specific episode parallels that illuminate the current moment, the honest assessments of where AI, space, and quantum actually sit in that framework, and the 16 trade setups that flow from the complete picture — both the correction positioning and the accumulation plays that the historical record identifies as the path to Stage V wealth.
The argument is not that AI, commercial space, and quantum computing will fail. They will not. The argument is more precise: the relationship between the technology being real and the current investment being sound is not the relationship most market participants assume it is. That distinction has been the difference, in every prior episode the historical record contains, between the investors who funded the revolution and the investors who profited from it.
The railways transformed Britain, Europe, and the world. Of the hundreds of railway companies that went public between 1844 and 1847, almost all failed. The man who eventually built the dominant railway empire — Cornelius Vanderbilt — did not invest during the mania. He waited for the wreckage and bought what remained at sane prices in the 1850s. The technology was correct. The timing of the investment was everything.
Part I: The Morning Everything Changed
On June 12, 2026, SpaceX listed on the Nasdaq as SPCX at $135 per share, implying a market capitalisation of approximately $1.75 trillion. By June 16 it had traded as high as $225.64. By the time this report was written, it had settled at $174.90 — still valued at 73 times annual revenues. To put that number in context: Amazon went public in 1997 at 7 times sales, and was called absurdly overvalued by the serious analysts of its day. Google listed in 2004 at 14 times sales, to similar scepticism. Both went on to define the next twenty years of economic life. SpaceX listed at 73 times. Whether that is visionary or delusional is the central question of our time — and the historical record provides a clear framework for thinking about the answer, even if it does not provide certainty.
Rocket Lab, one of SpaceX’s closest competitors, fell 18% the same day SpaceX listed. Not because anything had changed at Rocket Lab. Because the gravitational pull of the new arrival was so great that capital flew toward it, leaving everything in its orbit temporarily diminished. Rocket Lab trades at $101.27. Its 52-week range runs from $27.84 to $151.00. It has a Strong Buy consensus. Its first-quarter revenue grew 63.5% year over year. And it fell 18% in a single session because SpaceX listed. That dynamic — capital concentration around the dominant name in a new sector at the expense of everything adjacent — is one of the most consistent patterns in the historical record. It happened with railroads. It happened with internet infrastructure. It is happening in commercial space.
The Anthropic and OpenAI S-1 filings arriving in the same week are the second and third elements of an extraordinary convergence. Two companies that together are seeking valuations of close to $2 trillion in public markets — against combined projected losses in 2026 of roughly $40 billion, and combined revenues of approximately $72 billion in annualised run rate. The implicit comparable in the pricing of both companies is not a software company or even a platform company. It is Microsoft — the operating system on which the next generation of business is built. That may be exactly right. It may prove to be a comparison that looks, in ten years, the way comparing Pets.com to Amazon looks now. The difference matters enormously for anyone making capital allocation decisions today.
Part II: The Five Stages — A Map That Does Not Change
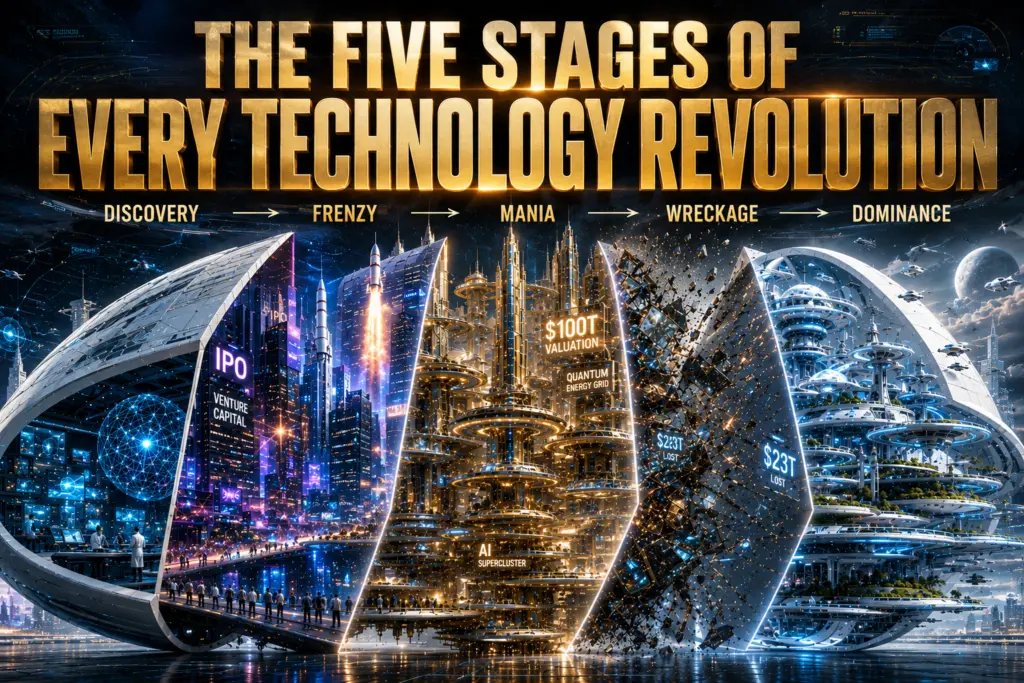
Across 389 years of documented financial history, every major technology revolution has passed through five stages in the same sequence. Not most of them. All of them. The stages are not a theory constructed to fit the evidence. They are a description of a mechanism that repeats because the underlying drivers — human psychology, the pace at which institutions process new information, the relationship between speculative capital and productive capital — do not change from episode to episode.
STAGE
WHAT IT LOOKS LIKE
I
Discovery
The technology works, but only specialists know it. Early adopters earn extraordinary returns. Valuations are high but defensible against actual cash flows.
II
Frenzy
Mainstream capital arrives. IPOs succeed at breathtaking valuations. The narrative replaces the numbers as the primary basis for allocation decisions. Being wrong about the story feels more dangerous than being wrong about the price.
III
Mania
WE ARE HERE
Speculation displaces analysis entirely. Every company becomes a technology company. The CAPE ratio exceeds 35. The Buffett Indicator breaks 200%. The phrase ‘this time is different’ is spoken without irony by people who should know better.
IV
Wreckage
A trigger breaks the loop. Declines of 60% to 90% arrive faster than almost anyone prepared for. The majority of companies in the sector fail. The technology itself continues to develop, often accelerating, without them. The infrastructure they built remains.
V
Dominance
Two or three genuine survivors, building on post-crash infrastructure that now costs a fraction of its peak price, capture the transformative value that the original investors priced but never earned.
The most important thing to understand about this framework is the relationship it implies between the technology and the investment. They are not the same thing. They are governed by entirely different timelines and entirely different logic. Being right about the technology — which the companies in Stage II and III often are — is not the same as being right about the investment. This distinction is the analytical core of the entire argument that follows.
WorldCom installed 80 million miles of fibre-optic cable during the mania of the late 1990s. The cables are still in the ground. They carry the internet that you are reading this report on right now. WorldCom went bankrupt in 2002, at the time the largest bankruptcy in American history. The investors who funded the cable-laying lost most or all of their capital. The technology they funded is still working.
Part III: 389 Years of the Same Story
The following table is the complete historical record. Not a selection of convenient examples, but every major technology-driven market cycle in the documented financial record from 1634 to the present. The data varies in reliability by era — seventeenth century numbers come from reconstructed price series, while anything from 1900 onwards uses primary sources. The pattern is consistent across every era where sufficient data exists to test it.
EPISODE & TECHNOLOGY
PEAK TO TROUGH
RECOVERY TIME
WHO ACTUALLY WON
British Railways 1844-47 / Steam rail & mass logistics
-85% average
20 years
Vanderbilt. Consolidators who bought the wreckage at sane prices in the 1850s and built the dominant networks.
Roaring Twenties 1924-29 / Radio + autos + aviation
-89% (DJIA)
25 years
GE. Ford. IBM (founded 1911, dominant from the 1950s). AT&T. The companies with real cash flows underneath the narrative.
Japan Bubble 1983-89 / Electronics + manufacturing
-82% (Nikkei)
35 YEARS / (Feb 2024)
Toyota. Sony. Nintendo. The companies that survived without external capital during the Valley.
Dot-Com 1995-2000 / Internet + telecom + biotech
-78% (NASDAQ) / -49% (S&P 500)
15 years / (NASDAQ)
Amazon. Google. Salesforce. Microsoft (reconstituted). The companies that built real businesses quietly during Stage IV.
The Fifth Wave 2020-26+ / AI + Space + Quantum
TBD / History: -40% to -78%
TBD / History: 5 to 25 yrs
TBD. The subject of Part VII.
The Japan row deserves a moment of attention that it rarely receives in discussions of current valuations. The Nikkei peaked in December 1989. It did not return to that nominal peak until February 2024. Thirty-five years. An investor who bought the Nikkei in December 1989 — at a market that was expensive but justifiable against Japan’s extraordinary economic growth — waited thirty-five years to break even in nominal terms, and considerably longer in real terms. Japan is not an anomaly or an edge case. It is the most extreme version of the mechanism that appears in every row of the table above.
The dot-com parallel is the most recent and therefore the most directly comparable. Amazon fell from $113 to $5.51 between 1999 and 2001 — a decline of 95%. The investors who held through that decline and added to their positions are now holding one of the greatest investments in the history of public markets. The investors who bought at $113 in 1999 and sold at $5.51 in 2001 are not those investors. They are the investors who funded the infrastructure that Amazon used to dominate the next twenty years of commercial life. They were right about everything — the company, the technology, the competitive position — except the price and the timeline.
The most counterintuitive point in this entire report: the companies that fail in Stage IV are often the ones that built the most real infrastructure during Stage II and III. They were right about the technology and catastrophically wrong about the economics. The pioneer and the winner are different people in almost every episode the historical record contains.
Part IV: The Three Technologies — Honest Assessments
Commercial Space
SpaceX is not a speculative technology company. It has reduced the cost per kilogram to orbit from approximately $60,000 in the Space Shuttle era to approximately $2,700 today — a 96% reduction in fifteen years. Starlink is a genuinely profitable satellite internet business generating approximately $6 billion in EBITDA on $10 billion in revenue, serving over 4 million subscribers, with a structural moat that no competitor can replicate without a decade and tens of billions in capital. These are real assets generating real cash flows.
At 73 times sales, however, the stock price is not asking whether SpaceX is a good business. It is asking whether SpaceX will commercialise orbital manufacturing, establish a viable Mars economy, and maintain unchallenged dominance against well-capitalised competitors for decades to come — with no margin of safety whatsoever at $174.90 per share. All of those outcomes may occur. None of them are currently being priced with any acknowledgement that they might not.
The smaller space companies — Rocket Lab at $101.27, currently 52-week range $27.84 to $151.00 with Q1 revenue growing 63.5%; AST SpaceMobile; Intuitive Machines — carry one specific risk that their valuations do not adequately reflect. A company that raised $75 billion in its IPO and has the cost structure of SpaceX can price aggressively in any adjacent market it chooses to enter. In the railway era, the dominant carrier routinely drove adjacent competitors into bankruptcy by temporarily pricing below cost on competing routes. Capital without constraints is the most effective competitive weapon in the history of capitalism.
Artificial Intelligence
Artificial intelligence satisfies every criterion economists use to classify a General Purpose Technology — the category that includes the steam engine, electricity, and the internal combustion engine: technologies that diffuse across every sector of the economy and generate complementary innovations for decades after their introduction. The empirical evidence for AI’s current diffusion is genuinely strong: measured productivity gains of 20 to 40% for knowledge workers using frontier models, documented enterprise deployment at scale across medicine, law, finance, and engineering, and real disruption of workflows that had been unchanged for a generation. The technology is real.
Anthropic at $965 billion private valuation with $47 billion in annualised revenue and approaching its first operating profit is valued at approximately 20 times sales. High for most industries, but defensible for a high-growth enterprise software company approaching profitability for the first time. The financial profile is credible. The IPO target of $1.0 to $1.15 trillion implies a slight premium to private market valuation — unusual for a company this size, and worth watching as a signal about IPO market conditions at the time of listing.
OpenAI at $852 billion private valuation with $25 billion in annualised revenue is valued at approximately 34 times sales — and is projected to lose between $25 and $27 billion in 2026 on a GAAP basis. It has committed $600 billion to infrastructure spending and does not project positive cash flow until 2030. Its implicit comparable in the market’s pricing is Microsoft — the operating system of the next generation of business. That may be exactly right. Its actual financials, when disclosed, will look considerably more like Google’s. The gap between those two comparisons is not a minor distinction.
Quantum Computing
In December 1947, three physicists at Bell Labs demonstrated the transistor. The first commercial transistor radio appeared in 1954. The integrated circuit arrived in 1958. The personal computer did not appear until 1977. Intel, which would eventually dominate the semiconductor industry for forty years, was founded in 1968 — twenty-one years after the transistor’s invention. The parallel for quantum computing is this: in 2024, Google’s 105-qubit Willow chip achieved below-threshold quantum error correction — meaning that adding more physical qubits actually reduces error rates rather than amplifying them. This is the transistor moment. The physics is proven. The engineering challenge that remains, if the semiconductor parallel holds, will take the better part of a decade to translate into commercial applications.
IonQ’s revenue growth of 755% year over year is extraordinary. Its absolute revenue base is small. The quantum computing market is projected to grow from approximately $1.4 billion today to $170 billion by 2040 — a 120-fold expansion over fifteen years, consistent with the semiconductor market’s growth trajectory following the integrated circuit. The investors who will make the most money from quantum computing are probably those who will be able to buy in Stage IV, when the technology is real and proven and the market has forgotten it existed. The $56.55 price for IonQ today implies a market that is pricing the destination, not the journey.
Part V: The Valuation Context
There is a structural reason why the broad market valuation matters for specific technology investments even when those specific technologies are genuinely transformational. In a Stage IV decline, correlation approaches 1. Forced selling is not selective. It hits the genuine winners and the frauds with approximately equal brutality in the first phase. Amazon at $5.51 in 2001 was not a failed company. It was the most commercially important company of the following two decades, temporarily priced as though it was about to fail, because the market that surrounded it was liquidating everything.
The CAPE at 40.43 is the second-highest reading in 145 years of data. Only December 1999 at 44.19 was higher. The Buffett Indicator at 233.8% is an all-time record, 64.9% above its long-run trend. The top ten S&P 500 names represent 40% of the total index weight, also an all-time record. NVIDIA at $210.33 and a market cap of $4.95 trillion. Microsoft at $379.10, down 19% year-to-date from its all-time high of $555.45. Palantir at $128.63, down 27% year-to-date from $207.52 despite first-quarter revenue growing 85%. These declines are not the crash. They may be its earliest visible signal. What is not ambiguous is the valuation context in which they are occurring.
The Buffett Indicator at 233.8% means the market is priced at 2.3 times the entire annual output of the United States economy. That ratio has only been above 200% on two prior sustained occasions — both were followed by significant corrections. At 40.43, the CAPE is consistent with forward ten-year real returns of approximately 1 to 3% annually based on historical regression, versus the 7% long-run average. These are not extreme scenarios invented to manufacture alarm. They are the median outcomes implied by the data at this valuation level.
Part VI: What Comes Next — Three Phases
Phase A: The Near Term (0-18 Months)
The triggers that historically have broken Stage III manias share a common characteristic: they were not the trigger anyone was watching for. The dot-com bubble was not broken by a failure of the internet. It was broken by a combination of rising interest rates and the revelation that specific company financials did not match their narratives. The 1929 crash was not triggered by a failure of radio or automobiles. It was triggered by the exhaustion of margin credit. In the current context, the triggers worth monitoring include: any sustained move in 10-year Treasury yields above 5.25%; meaningful deterioration in hyperscaler earnings guidance suggesting AI capex is not generating expected returns; an Anthropic or OpenAI IPO that reveals financials materially more concerning than the private market has priced; or a geopolitical shock that redirects institutional capital from growth to safety. No specific trigger can be identified with precision. The mechanism is loaded. Triggers are identified retrospectively.
Phase B: The Valley (18 Months to 5+ Years)
The Valley is the period in every prior episode when the technology continued developing — often accelerating — while the market associated with it was either flat or still declining. Between 2000 and 2004, the internet added 300 million users globally. Amazon expanded from books into electronics, clothing, and the early stages of cloud computing. Google went public and began building the advertising infrastructure that would make it one of the most profitable companies in history. All of this happened while the NASDAQ was still well below its 2000 peak. The Valley is where patient capital, buying durable businesses at post-crash prices, has generated every major technology fortune in the historical record. It is psychologically the most difficult period: the technology works, the narrative has collapsed, and the market has decided the revolution was a fraud. It was not. It was a revolution on the wrong timeline.
Phase C: Dominance
The companies that achieve Stage V dominance are almost never the most celebrated names at the Stage III peak. They are the ones with the strongest economics underneath the narrative — the ones that could survive without external capital, whose competitive positions were real rather than constructed from story and promotional capital. In the 1930s, it was Ford and GE, not the radio companies trading at 90 times earnings in 1929. In the 2000s, it was Amazon and Google, not WorldCom or Pets.com. The question for the current wave is which two or three companies emerge from Stage IV with their infrastructure intact, their competitive moat unchallenged, and their financials able to generate the cash flows that eventually justify — at Stage V prices — the valuations that Stage III investors paid.
Part VII: 16 Positions — One Framework, Both Sides
Every position below is derived from the same framework. The market is at a historic valuation extreme. A meaningful correction is the base case over a 12 to 24 month horizon based on the complete historical record at comparable valuations. But the technologies are real, the eventual Stage V opportunities will be extraordinary, and the investors who miss Stage IV accumulation will miss the most important part of the cycle. The setups below reflect both sides of that analysis. The shorter-term positions address the correction probability. The longer-term positions address the renaissance certainty.
Stage III / Stage IV — Risk Reduction
S&P 500 REDUCE EXPOSURE
CAPE 40.43 + Buffett 233.8% = historic valuation extreme. Not structural short — risk management rebalancing. Fade pushes above recent highs.
Entry: Fade above 7,650 Stop: 7,800 Target: 6,800-7,000 Horizon: 12-18 months
NVIDIA (NVDA) PARTIAL EXIT ABOVE $220
$4.95T market cap at 73x sales. The AI infrastructure bet is real. The price embeds near-perfection with no margin of safety. Partial profit-taking; reaccumulate in Stage IV.
Entry: $210-$220 — reduce 30% Stop: $240 Target: $140-$160 accumulation zone Horizon: 6-18 months
Palantir (PLTR) AVOID NEW ENTRIES
Down 27% YTD despite Q1 revenue +85%. Government and enterprise AI deployment story is genuine. But Stage IV entry provides the margin of safety current levels lack.
Entry: $90-$100 post-correction Stop: $130 Target: $155-$175 Horizon: 18-36 months
OpenAI IPO WAIT — DO NOT CHASE
$852B valuation, $25-27B GAAP losses in 2026, cash-flow-positive 2030. The 1999 IPO class comparison is unavoidable. Patient capital waits for the grey market to find equilibrium.
Entry: 60-90 days post-IPO price Stop: N/A Target: Reassess at post-IPO clearing price Horizon: Indefinite wait
Gold (XAU/USD) LONG — ACCUMULATE DIPS
In Stage IV equity repricing, gold historically captures the flight from risk assets AND the real-rate compression that follows central bank response. Current gold at $4,154 — buy dips.
Entry: $4,000-$4,100 Stop: $3,750 Target: $5,000+ over 18 months Horizon: 12-24 months
USD/JPY SHORT AT 161-163 ZONE
BoJ hiked to 1.00% June 19. Summary of Opinions shows further hikes on the table. FM Katayama-Bessent coordination call = diplomatic-grade intervention signal. Asymmetric reward at the 1986-era high.
Entry: 161.80-162.00 Stop: 163.00 Target: 157.50-158.50 Horizon: 4-12 weeks
Stage IV / Stage V — Accumulation Framework
SpaceX (SPCX) WAIT FOR STAGE IV ENTRY
73x sales at $174.90 is not the entry. The infrastructure is real. The moat is real. Amazon fell 95% before becoming the investment of a generation. Stage IV brings the margin of safety.
Entry: $60-$80 (Stage IV target) Stop: $45 Target: $400+ (Stage V) Horizon: 3-7 years
Rocket Lab (RKLB) CONDITIONAL LONG — STAGE IV
Q1 revenue +63.5%. Second-mover advantage in launch is real if SpaceX focuses on Starship orbital manufacturing. Current $101.27 has already run. Stage IV creates the entry.
Entry: $35-$45 (Stage IV) Stop: $25 Target: $200+ (Stage V) Horizon: 3-5 years
Anthropic (post-IPO) ACCUMULATE ON IPO WEAKNESS
Most financially credible major AI company. $47B ARR approaching first profit. If it IPOs at $1T+ and follows the historical pattern, Stage IV creates the accumulation opportunity.
Entry: 40-60% below IPO price Stop: IPO price -70% Target: 5-10x IPO price (Stage V) Horizon: 5-10 years
IonQ (IONQ) SMALL POSITION — VENTURE SIZING
The transistor moment was 2024. Intel was founded 21 years after the transistor. Quantum is Stage I-II. Venture sizing only until commercial applications are proven at scale.
Entry: $25-$35 (Valley entry) Stop: $15 Target: $200+ (post-commercial) Horizon: 7-15 years
Copper (HG) STRUCTURAL LONG — $6.15
491,000-ton annual deficit through 2030 (Jefferies). AI data centres, EV infrastructure, quantum hardware. Every Stage V technology winner consumes copper. Structural deficit is indifferent to the equity cycle.
Entry: $6.15 accumulation entry Stop: $5.95 Target: $7.50-$8.00 Horizon: 12-36 months
Bitcoin (BTC) ACCUMULATE $60-$65K
At $62,800 and testing the range floor. Institutional treasury adoption thesis strengthens through Stage IV as corporations use BTC as a hedge against currency debasement in the post-crash response.
Entry: $60,000-$65,000 Stop: $52,000 Target: $100,000+ (Stage V) Horizon: 2-5 years
Microsoft (MSFT) ACCUMULATE ON WEAKNESS
Down 19% YTD from $555.45. Office 365, Azure, Teams, GitHub Copilot integration at scale. Of all large-cap AI names, MSFT has the most defensible earnings base through Stage IV.
Entry: $280-$320 (Stage IV) Stop: $250 Target: $600+ (Stage V) Horizon: 3-5 years
Alphabet / Google (GOOGL) ACCUMULATE $340-$360
$367.32 at writing. TPU v5 architecture. Gemini across Search, Cloud, Maps. The advertising cash machine that funds the AI buildout. Stage IV creates the entry that Stage III does not offer.
Entry: $340-$360 Stop: $300 Target: $550+ (Stage V) Horizon: 3-5 years
Amazon (AMZN) THE HISTORICAL TEMPLATE
Fell from $113 to $5.51 in the dot-com crash. Buyers at $5.51 made the investment of a generation. AWS + retail + logistics + Alexa. Stage IV is when this position makes sense.
Entry: $140-$160 (Stage IV) Stop: $120 Target: $400+ (Stage V) Horizon: 3-5 years
Quantum Basket (IONQ / others) PATIENT ACCUMULATION
Stage II-III. Intel was founded 21 years after the transistor. Patient capital in the Valley earns the Stage V reward. Size as venture, not as equity allocation.
Entry: $15-$25 per name (Valley) Stop: N/A Target: TBD — decade horizon Horizon: 7-15 years
The Closing Argument
Every technology revolution in the documented financial record has ended the same way: the technology proved real and transformational, the first investors were destroyed, and the second wave — the patient capital that bought the wreckage — built fortunes. The railways did not fail because trains were a bad idea. The internet companies did not fail because the internet was a bad idea. WorldCom installed the cables this report is being read on. Its investors lost everything. The cables are still there.
The Renaissance is coming. SpaceX will likely reduce the cost of getting to orbit to a level that makes space industrial activity commercially viable within a decade. Artificial intelligence will restructure knowledge work across every profession with measurable productivity gains already documented at scale. Quantum computing will, eventually, solve optimisation problems in drug discovery, materials science, and logistics that currently require months of classical computation. These outcomes are, in the view of the Capital Street FX Research Desk, highly probable over a 20 to 30 year horizon.
The question this report has tried to answer is narrower than that. It is: at CAPE 40.43, Buffett Indicator 233.8%, and SpaceX at 73 times sales, does the current market price reflect the probability that anything goes wrong on the way to those outcomes? The historical record says it does not. The historical record also says that the investors who will earn the most from the coming Renaissance are not the ones buying today at Stage III prices. They are the ones who will buy in Stage IV at prices that reflect the probability that something, somewhere, has gone wrong.
Position for both sides. Protect the capital in Stage III. Deploy it systematically in Stage IV. Own the survivors into Stage V. That is the complete playbook. The historical record does not offer a better one.
Read Full Report: capitalstreetfx.com/market-analysis/daily-market-analysis/

Comments
No comments yet. Be the first to share your thoughts!
Authentication Required
You must be logged in to post a comment.