The Trend Is My Friend

As long as I traded against the trend, I kept losing. The moment I made friends with it, everything changed.
Hi, this is NorthRay.💪
There was a time when I opened trades simply because “the price is too high, it has to fall now” or “the price is too low, it has to rise now.”
I wasn’t paying attention to the trend. I was trading my feelings.
And do you know what happened?
During an uptrend, I would open Sell positions (because “it can’t keep going up forever”). The price kept rising. My losses kept growing. I held on, hoping for a reversal. Eventually, I either closed at a loss or got stopped out.
Then I read a phrase that every experienced trader repeats:
“The trend is your friend.”
I decided to test it. And surprisingly, once I started trading with the trend, my trades began closing in profit much more often. Not always, but noticeably more often.
Today I’ll explain what trends are, how to identify them, and why trading against them is like swimming upstream in a mountain river.
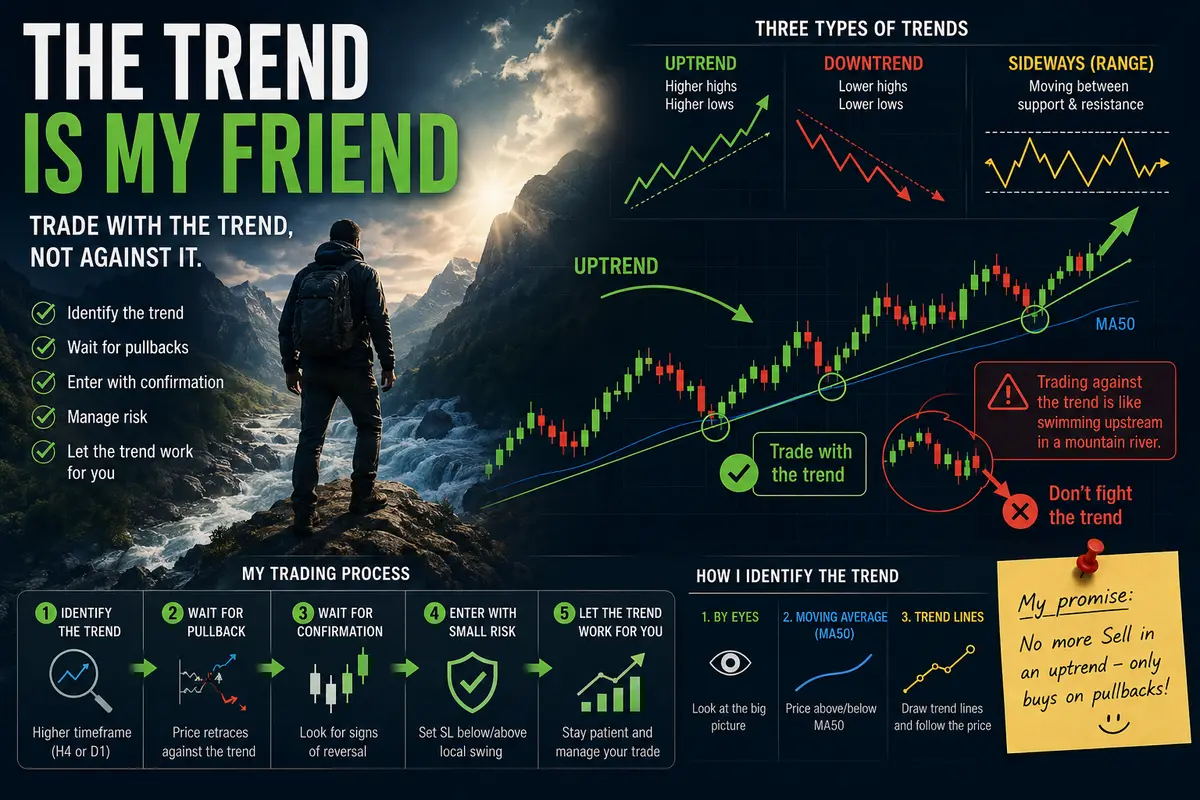
What Is a Trend? (The Simplest Explanation)
A trend is the direction of price movement.
-
If the price is moving up, it’s an uptrend (bullish trend).
-
If the price is moving down, it’s a downtrend (bearish trend).
-
If the price is moving sideways within a range, it’s a sideways trend (range or consolidation).
Think of it this way:
Imagine you’re standing on an escalator.
An uptrend is an escalator moving upward. You can stand still and it will carry you up. You can walk up and get there faster. But if you try to walk down, you’ll struggle.
A downtrend is an escalator moving downward. Walking up is difficult and risky.
A sideways market is an escalator that isn’t moving. You can walk either way, but you get no help.
Trading with the trend is like moving in the same direction as the escalator. The market helps you. Trading against the trend is like fighting the escalator. It’s possible, but it’s hard and painful.🧠
Three Types of Trends (And How to Tell Them Apart)
1. Uptrend (Bullish)
The chart forms higher highs and higher lows.
Each new peak is higher than the previous one. Each new low is also higher than the previous low.
What I do during an uptrend:
-
Look for BUY opportunities.
-
Enter trades on pullbacks.
-
Only consider a Sell trade if there’s an exceptionally strong reason.
2. Downtrend (Bearish)
The chart forms lower highs and lower lows.
Each new peak is lower than the previous one.
What I do during a downtrend:
-
Look for SELL opportunities.
-
Enter trades on upward pullbacks.
-
Only consider a Buy trade if there’s an exceptionally strong signal.
3. Sideways Trend (Range)
Price moves between two horizontal levels with no clear direction.
What I do in a range:
-
Buy near the lower boundary (support).
-
Sell near the upper boundary (resistance).
-
Avoid holding trades for too long because the range can break at any moment.
How I Identify the Trend (Simple Methods)
There are many ways to do it. I use three, and they’re more than enough to get started.
Method #1: Use Your Eyes
I open a chart on the H1 or H4 timeframe and look at the bigger picture.
-
Is the price moving up?
-
Are highs and lows rising?
→ Uptrend.
-
Is the price moving down?
→ Downtrend.
-
Is it bouncing between two levels?
→ Sideways market.
Sounds too simple?
Try it. After a few days, your eyes start recognizing trends naturally.
Method #2: Moving Average
I use a 50-period Moving Average (MA50).
-
Price above MA50 → likely an uptrend.
-
Price below MA50 → likely a downtrend.
-
MA50 sloping upward → bullish trend.
-
MA50 sloping downward → bearish trend.
-
MA50 flat → range.
It’s not a holy grail, but it’s a great tool for beginners.
Method #3: Trend Lines
I draw a line through the lows (for an uptrend) or through the highs (for a downtrend).
As long as the line holds and the price keeps bouncing from it, the trend remains intact.
My Biggest Mistake: Trading Against the Trend
This used to be my favorite strategy.
People call it “top picking.”
Here’s what it looked like:
The market rises for a day, two days, a week.
I look at it and think:
“That’s it. It has to reverse now. It’s gone too high.”
I open a Sell position.
The price rises further.
I move my stop-loss higher.
The price rises again.
I get stopped out and lose money.
Then the market finally reverses and drops.
Right from the level where I originally entered my Sell.
But I’m already out.
I lost money even though I was right about the direction.
I was simply too early.🤏
Why This Is a Bad Idea
-
Markets can remain overbought for weeks and continue rising.
-
There is no upper limit if investors believe in further growth.
-
Trying to catch a falling knife or stop a runaway rally is extreme sports, not trading.
What I Do Now
I identify the trend first.
Then I trade in the direction of the trend.
-
Uptrend → look for BUY opportunities.
-
Downtrend → look for SELL opportunities.
I stopped trying to outsmart the market.
The market is always right.
How I Trade With the Trend (My Process)
It’s simple and tested in practice.
Step 1: Identify the Trend on a Higher Timeframe
I look at the D1 or H4 chart.
I figure out which way the wind is blowing.
Step 2: Move to a Lower Timeframe for Entry
I switch to H1 or M30.
Then I wait for a pullback against the trend.
Example:
If the trend is bullish, I wait for the price to pull back slightly before looking for a Buy setup.
Step 3: Wait for Confirmation
I don’t jump in on the first move.
I wait for the pullback to finish and for price to start turning back in the direction of the trend.
Step 4: Enter With a Small Position Size
I place:
-
A stop-loss below the local low (for BUY trades).
-
A stop-loss above the local high (for SELL trades).
My take-profit goes near the next significant level.
Step 5: Don’t Exit Too Early
I trust the trend.
I don’t panic over small pullbacks.
A Real Example From My Trading
Recently, I traded the S&P 500 (US500).📉
Step 1
On H4, I identified an uptrend.
Price had been rising for several days, with higher highs and higher lows.
Step 2
On H1, I waited for a pullback.
The market dropped about 0.5% from the local high.
Step 3
The Stochastic indicator showed oversold conditions during the pullback.
Price began turning upward again.
Step 4
I opened a BUY position.
-
Lot size: 0.10
-
Stop-loss: below the pullback low
-
Take-profit: near the previous high
Result
The trade closed in profit.
Not a huge profit, but a profit.
More importantly, I wasn’t stressed because I was trading with the trend.
When Is It Okay to Trade Against the Trend?
Experienced traders do it.🤫
They have:
-
Experience
-
Market intuition
-
Enough capital to absorb multiple false entries
I’m still learning.
So my rule is simple:
No counter-trend trades.
Maybe one day I’ll specialize in catching reversals.
But for now, I’m learning how to walk before trying to run a marathon.
The only exception is a ranging market.
In a range, there is no trend.
You can trade both directions between support and resistance because there’s no dominant trend to fight.💡
What I Learned Today
First: The trend is my friend.
Trading with the trend is like floating downstream.
Trading against it is like rowing upstream.
Second: You can identify a trend using your eyes, a moving average, or trend lines.
You don’t need ten indicators.
One or two are enough.
Third: A classic beginner mistake is trying to catch reversals and trade against the trend.
That’s closer to gambling than trading.
Sometimes it works.
More often, it doesn’t.
Fourth: Even in a strong uptrend, losing trades still happen.
That’s why stop-losses exist.
My Trend-Trading Plan
-
Start every trade by identifying the trend on a higher timeframe (H4 or D1).
-
Trade only in the direction of the trend (or carefully trade the boundaries in a range).
-
Wait for pullbacks instead of chasing the first move.
-
Keep statistics on trend-following trades versus counter-trend trades. Numbers are the best teacher.
-
Eventually add a second indicator to measure trend strength (such as ADX).
What’s Next?
-
Continue trading with the trend across forex pairs, indices, and gold.
-
Keep collecting data and publish the results in a couple of weeks.
-
If there’s interest, I’ll write a separate post about how to recognize when a trend is ending and a reversal may be beginning.
If you’re still trying to catch reversals and trade against the trend, try one simple experiment:
Trade only with the trend for one week.
Just one week.
Then look at the results.
You might be surprised.🤞
Your NorthRay
(with trend lines drawn all over the H4 chart, MA50 turned on, and a promise to myself never to open a Sell position in an uptrend again—unless I’m taking a very short-term pullback trade).

Comments
No comments yet. Be the first to share your thoughts!
Authentication Required
You must be logged in to post a comment.