

Limit Order Books (LOB): Level 1, Level 2, and Level 3 Data Explained
When most retail market participants look at financial data feeds, they rely on basic candlestick charts and volume histograms. While these tools provide a visual history of past price action, they obscure the micro-structure of the market happening in real time. Beneath every chart lies the Limit Order Book (LOB)—a dynamic, centralized electronic ledger where all active buy and sell orders are queued, matched, and executed.
To gain an informational edge in modern electronic markets, a trader must understand how market data is structured across different tiers. Market data feeds are universally broken down into three distinct levels: Level 1, Level 2, and Level 3. Each tier provides a progressively deeper window into the mechanics of institutional execution, liquidity distribution, and matching engine operations.
Level 1 Data: Top-of-Book Pricing and Basic Quotes
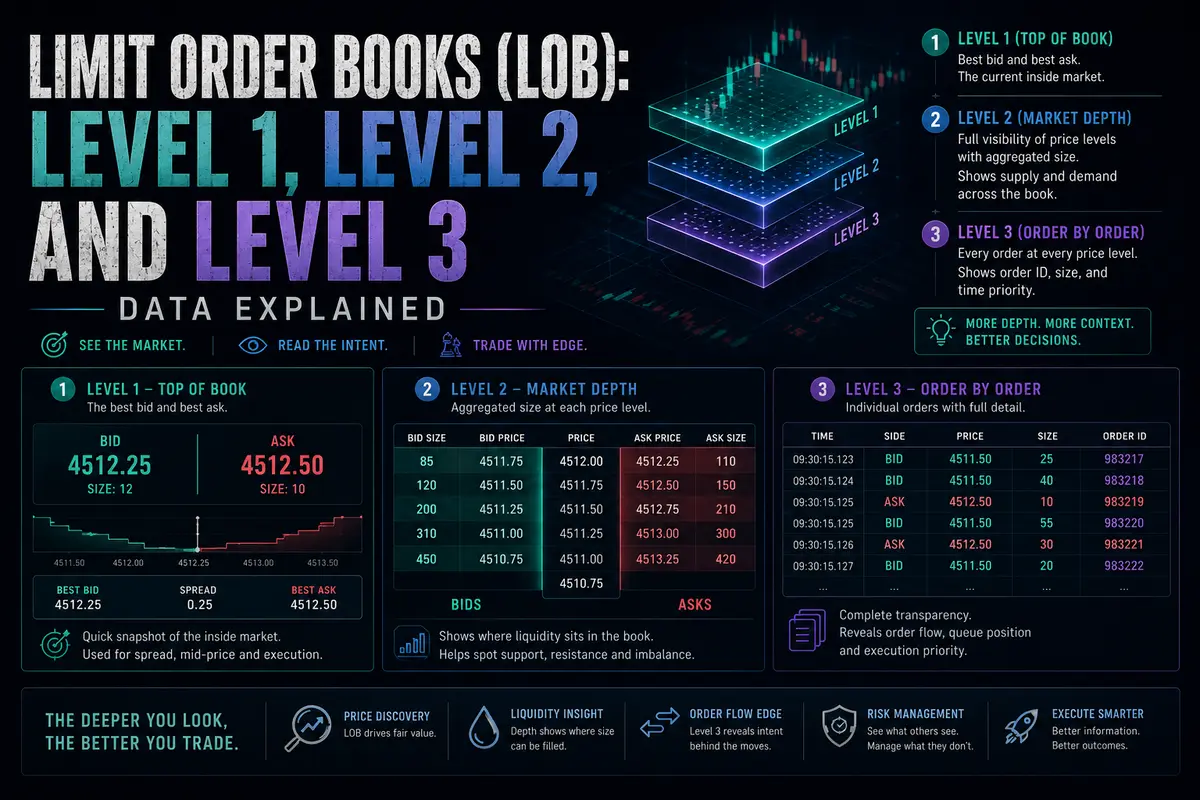
Level 1 data, commonly referred to as Top-of-Book data, represents the most basic feed available to retail traders. It provides real-time information regarding the absolute best prices currently available on both sides of the market.
An L1 data feed displays three core metrics:
-
The Best Bid: The highest price any passive market participant is currently willing to pay to buy the asset.
-
The Best Ask (or Offer): The lowest price any passive market participant is currently willing to accept to sell the asset.
-
The Last Sale Price and Volume: The exact price and size of the most recently executed transaction.
While Level 1 data is sufficient for swing traders or long-term investors who execute infrequently, it is entirely inadequate for active short-term traders. L1 hides the actual volume of resting liquidity behind the top price quote. For example, if the best bid is $100.00, an L1 feed tells you that buyers are willing to pay $100.00, but it completely conceals whether there are 10 shares or 10,000 shares waiting at that price level. Relying solely on Level 1 data is like driving a car while looking only at your immediate speedometer while remaining blind to the road ahead.
Level 2 Data: Depth of Market and Aggregate Queue Visibility
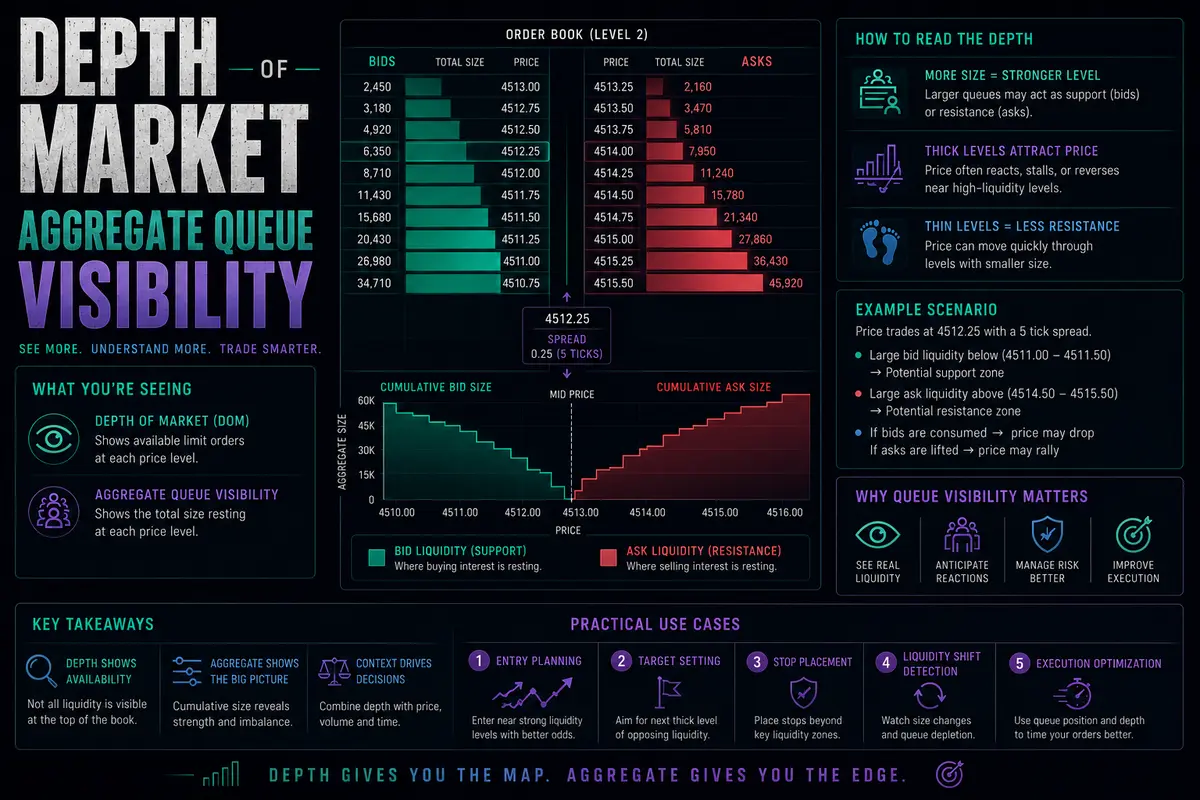
Level 2 data, formally known as Depth of Market (DoM), expands the window significantly. Instead of showing only the single best bid and ask, an L2 feed displays a ladder of multiple price tiers—typically the top five to ten price levels above and below the current market quote.
Each price level on an L2 ladder displays the aggregate volume of resting limit orders queued at that specific price. This gives traders a visual representation of supply and demand imbalances. For example, if you see 500 contracts stacked on the bid across three price levels, but only 50 contracts on the ask, you can deduce that buying interest is dense while selling resistance is thin.
However, Level 2 data comes with a critical structural limitation: Aggregation. On most standard retail L2 feeds, the volume displayed at a specific price level is an aggregate sum of all resting orders from various participants combined into a single number. You cannot see who placed the order, whether it belongs to a single massive institution or fifty retail traders, or how many individual orders make up that total volume. Furthermore, L2 feeds are prone to “spoofing”—where institutional algorithms flash large, fake limit orders on the book to deceive other market participants into believing massive support or resistance exists, only to cancel those orders milliseconds before price reaches them.
Level 3 Data: Complete Transparency and Individual Order Tracking
Level 3 data is the most granular, detailed, and expensive data feed available in financial markets. Unlike Level 2, which aggregates volume at price levels, Level 3 data displays every single individual order resting in the limit order book down to its unique order identification number.
L3 data provides complete transparency into the matching engine:
-
Order ID Tracking: Every single limit order placed into the book is tagged with a unique identifier. When that order is modified, partially filled, or canceled, you can track its exact lifecycle in real time.
-
Participant Attribution: In specialized institutional environments, L3 feeds allow authorized participants or market makers to see specific broker identifiers or participant codes attached to resting orders, revealing which institutions are actively providing liquidity.
-
True Queue Priority: Because L3 displays individual orders rather than aggregated sums, algorithmic execution engines can calculate their exact position in line at a specific price tier.
Level 3 data is utilized almost exclusively by high-frequency trading firms, quantitative market makers, and institutional execution desks. It requires specialized trading software, high-speed direct market access (DMA) connections, and massive processing power to parse millions of order updates per second without latency.
Practical Applications for Active Traders
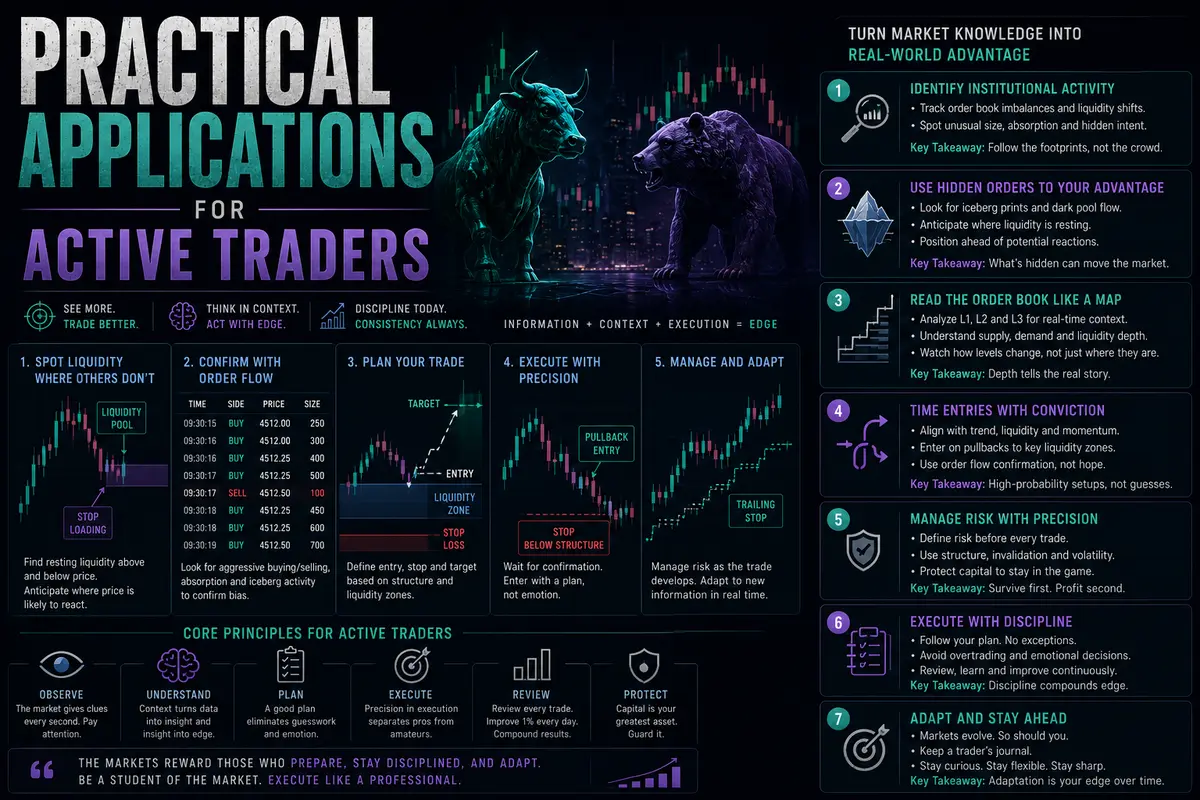
Understanding the structural hierarchy of Limit Order Books transforms how traders approach execution and market analysis:
-
Move Beyond Chart-Only Analysis: Incorporating Level 2 depth into your workflow allows you to identify where passive liquidity pools are dense. If price is rapidly approaching a price level with thousands of resting limit orders, expect a reaction or absorption phase rather than an immediate smooth continuation.
-
Beware of L2 Spoofing and Layering: Never make trading decisions based solely on massive size appearing on the Level 2 order book. Institutional algorithms frequently use fake liquidity walls to manipulate sentiment. Always cross-reference L2 order book depth with aggressive footprint execution volume to confirm whether resting orders are genuine or deceptive.
-
Match Your Data Tier to Your Strategy: If you are executing high-frequency momentum trades or scalping intraday liquidity, Level 2 depth is mandatory to spot short-term supply imbalances. If you are trading multi-day swing setups based on daily charts, L1 data and standard price action are more than sufficient.
By mastering how orders are queued, aggregated, and displayed across Level 1, Level 2, and Level 3 feeds, you gain a structural appreciation of market depth that separates professional execution from blind retail speculation.

Comments
No comments yet. Be the first to share your thoughts!
Authentication Required
You must be logged in to post a comment.