

The Anatomy of a Liquidity Sweep — Stop Runs vs. Genuine Breakouts
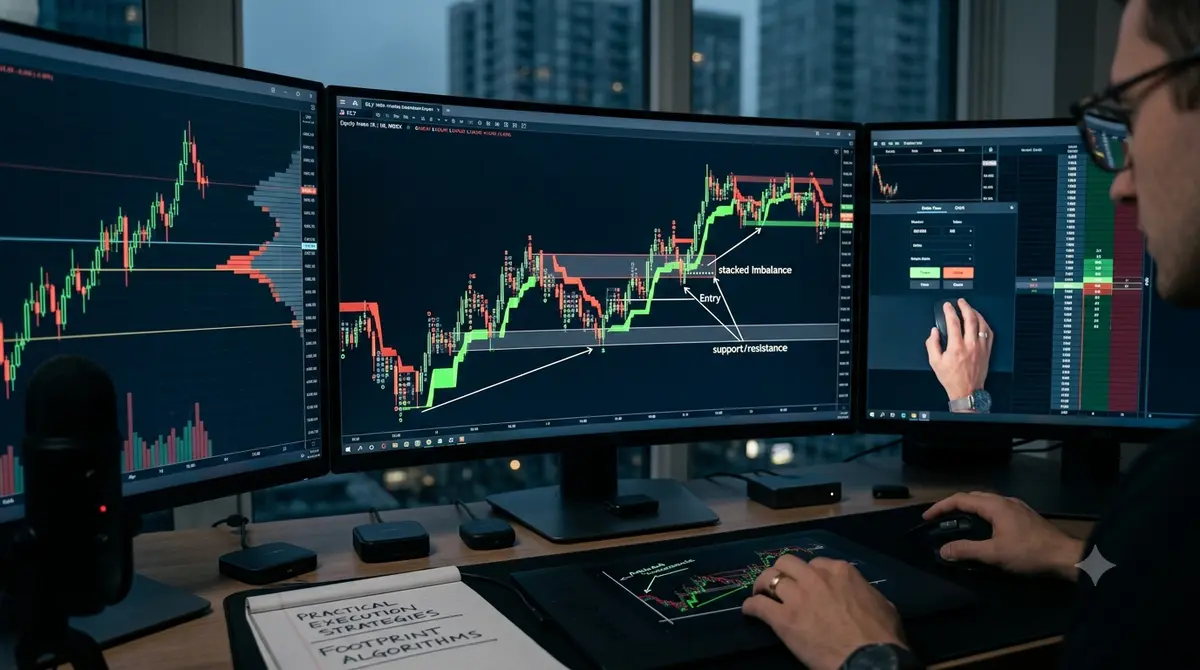
To the untrained eye, financial markets often appear chaotic and unpredictable. Price consolidates within a tight range for hours, suddenly spikes aggressively past a clear resistance level, and then abruptly reverses, dumping back into the range and leaving breakout traders trapped in losing positions. Retail traders routinely view this price action as a targeted manipulation directed at their personal stop loss. In reality, this dynamic is the natural consequence of institutional execution constraints operating within a central limit order book.
Large institutional market participants—such as hedge funds, sovereign wealth funds, and algorithmic market makers—face a fundamental challenge: they cannot simply enter a massive multi-million-dollar position at a single market price without driving execution costs catastrophically against themselves. To fill large orders, institutions require deep pools of counterparty liquidity. A liquidity sweep is the deliberate or structural process by which price is pushed into dense clusters of resting orders to unlock the volume required to fill institutional size.
The Mechanics of Structural Liquidity Accumulation
Every technical chart pattern is a map of liquidity distribution. Whenever price forms a obvious swing high, a double top, or a prolonged consolidation boundary, retail trading rules dictate standard risk management behaviors:
-
Traders holding short positions place their protective stop loss orders just above prominent technical high points. A protective stop loss on a short position is a stop-buy order.
-
Breakout traders place pending buy-stop orders above those same resistance levels, intending to buy as soon as momentum confirms a breakout.
This concentration of stop-buy and entry-buy orders creates a dense pool of resting buy liquidity sitting just beyond obvious technical swing highs. Conversely, beneath prominent swing lows or support levels lies a matching pool of sell liquidity, composed of protective sell-stops from long positions and sell-stop entry orders from breakout short sellers.
For a large institutional buyer looking to enter a long position, these pools of sell-stops offer the ideal liquidity event. To fill a massive buy order without causing slippage, the institution needs an equal volume of aggressive sellers. By driving price down into a major support zone where sell-stop loss orders are triggered, a flood of market sell orders is released into the order book. The institution absorbs these sell orders via passive limit buy orders, successfully filling their large position at a favorable price before allowing the market to reverse upward.
Dissecting the Sweep Sequence: Step-by-Step
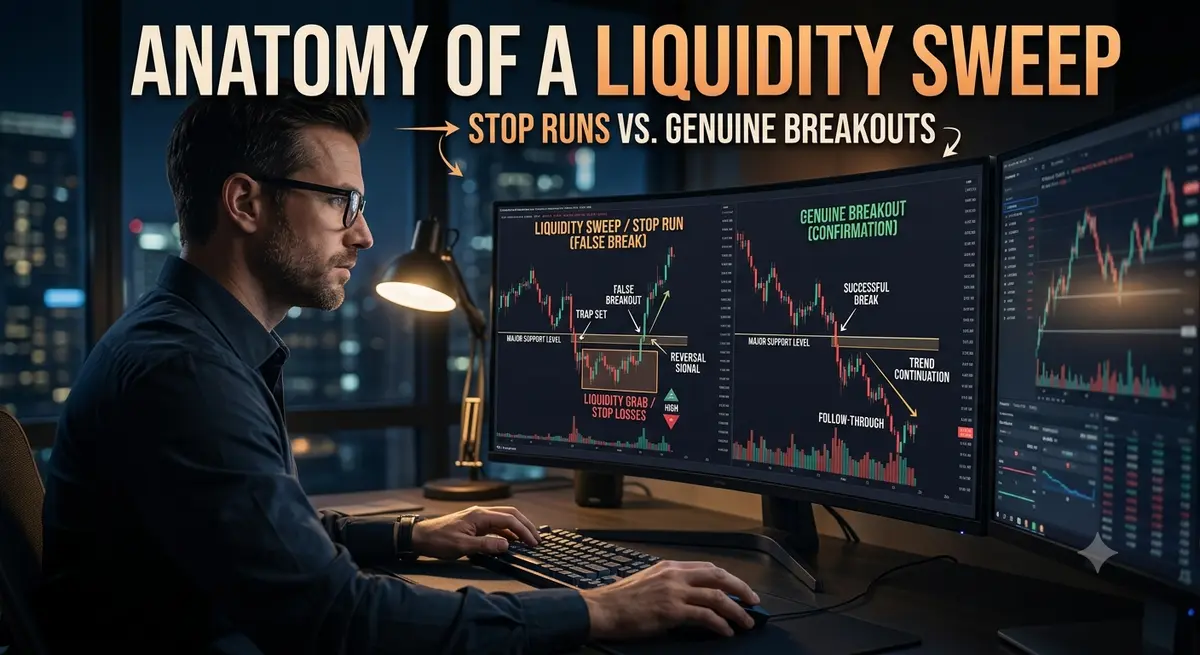
A liquidity sweep follows a distinct auction process that can be tracked through price action and order flow mechanics.
1. CONSOLIDATION & POOL CREATION
   Price ranges beneath obvious technical resistance.
   Stop-buy orders accumulate above the swing high.

2. THE AGGRESSIVE PUSH (THE SWEEP)
   Institutional buying or aggressive market lifting pushes price past resistance.
   Resting stop orders trigger, converting into a flood of market buy orders.

3. ABSORPTION AT THE EXTREME
   Large institutional limit sell orders (or icebergs) absorb the buy stops.
   Despite high volume execution, price fails to hold above the swept level.

4. REJECTION & REVERSAL
   With liquidity fully absorbed and buying interest exhausted, price snaps back into the range.
   Breakout buyers are trapped; stop-hunters are filled.
-
Building the Pool: Price establishes a clear range bound by visible support and resistance. As price tests a boundary multiple times without breaking, the concentration of resting stop orders behind that boundary grows significantly denser.
-
The Acceleration Phase: A surge of aggressive market orders pushes price through the technical boundary. The moment price crosses the threshold, resting stop orders are activated instantaneously, converting into a cascade of market orders that accelerates the movement.
-
The Absorption Zone: As the flood of market orders enters the book, passive limit orders sitting on the opposite side absorb the flow. If the sweep is engineered for accumulation or distribution, an institutional participant absorbs all incoming liquidity without allowing price to establish acceptance above the level.
-
The Rejection and Failure: Once the pool of stop liquidity is entirely consumed, aggressive buying or selling volume dries up instantly. Without sustained market order flow to lift higher asks or hit lower bids, the price action collapses back into the prior range, trapping breakout traders who entered at the extreme.
Differentiating a Liquidity Sweep from a Genuine Breakout
The single most critical task for an active trader during a volatility spike is distinguishing between a temporary liquidity sweep and a genuine structural breakout. While both events look identical as price crosses the boundary, their underlying order flow signatures diverge rapidly.
1. Order Book and Volume Profile
-
Liquidity Sweep: Features a sudden, extreme spike in volume as stop orders are triggered, followed immediately by a sharp drop-off in aggressive participation once the pool is cleared. The footprint chart shows heavy volume executing on the offer at the extreme high, but price closes back inside the range, forming a high-volume node at the wick of the candle.
-
Genuine Breakout: Features consistent, sustained volume that builds as price crosses the level. Instead of volume drying up, new aggressive market orders continue to enter the book, establishing higher low volume nodes as price rapidly builds new value above the broken level.
2. Price Acceptance vs. Price Rejection
-
Liquidity Sweep: Price spends very little time beyond the structural boundary—often just a matter of seconds or minutes. On higher timeframes, the move registers as a long upper or lower candle wick poking outside the range, accompanied by a close firmly back within prior value.
-
Genuine Breakout: Price displays clear acceptance outside the range. Candles close cleanly beyond the structural boundary, and subsequent pullbacks hold the old resistance as new support, demonstrating that buyers are comfortable transacting at higher valuations.
3. Delta and Market Participation
-
Liquidity Sweep: Shows a massive localized surge in positive delta (heavy buying) at the high of the move, but this buying fails to yield price continuation. This delta divergence—where strong buying volume produces a downward-closing candle—confirms that passive limit sell orders completely absorbed the move.
-
Genuine Breakout: Positive delta aligns with sustained upward price displacement across multiple consecutive candles, signaling that market buyers are actively chasing offers higher and pushing market makers to adjust quotes upward.

Tactical Execution and Risk Management Guidelines
Understanding the mechanics of a liquidity sweep allows traders to transform a common retail trap into a repeatable execution edge.
-
Stop Fading the First Move: Avoid placing market orders to trade breakouts on the initial test of a obvious technical boundary. Wait for the market to demonstrate price acceptance above or below the level before entering momentum positions.
-
Execute the Sweep Reversal Setup: When price sweeps a well-defined liquidity pool (such as previous day high or equal highs) and immediately prints a strong rejection candle closing back inside value, enter a mean-reversion trade back toward the opposite side of the range. Place your stop loss just beyond the absolute high of the sweep wick.
-
Target Opposite Liquidity Pools: Markets move from one liquidity pool to another. If a bullish sweep of a daily resistance level fails and price reverses into the range, the natural target for the resulting move is the sell-side liquidity pool resting beneath the opposite swing low.
-
Refine Stop Placement Beyond Obvious Levels: Recognize where the crowd places their stops. Rather than hiding your protective stop loss directly behind obvious double tops or swing extremes, place your risk boundary beyond the logical liquidity sweep zone to avoid getting cleared out by institutional absorption runs.

Comments
No comments yet. Be the first to share your thoughts!
Authentication Required
You must be logged in to post a comment.