Daily Analysis 12 June 2026 | Dollar Holds Firm Near 100 While Oil and Gold React to Middle East Tensions

Currency and Commodity Analysis:
US Dollar Index
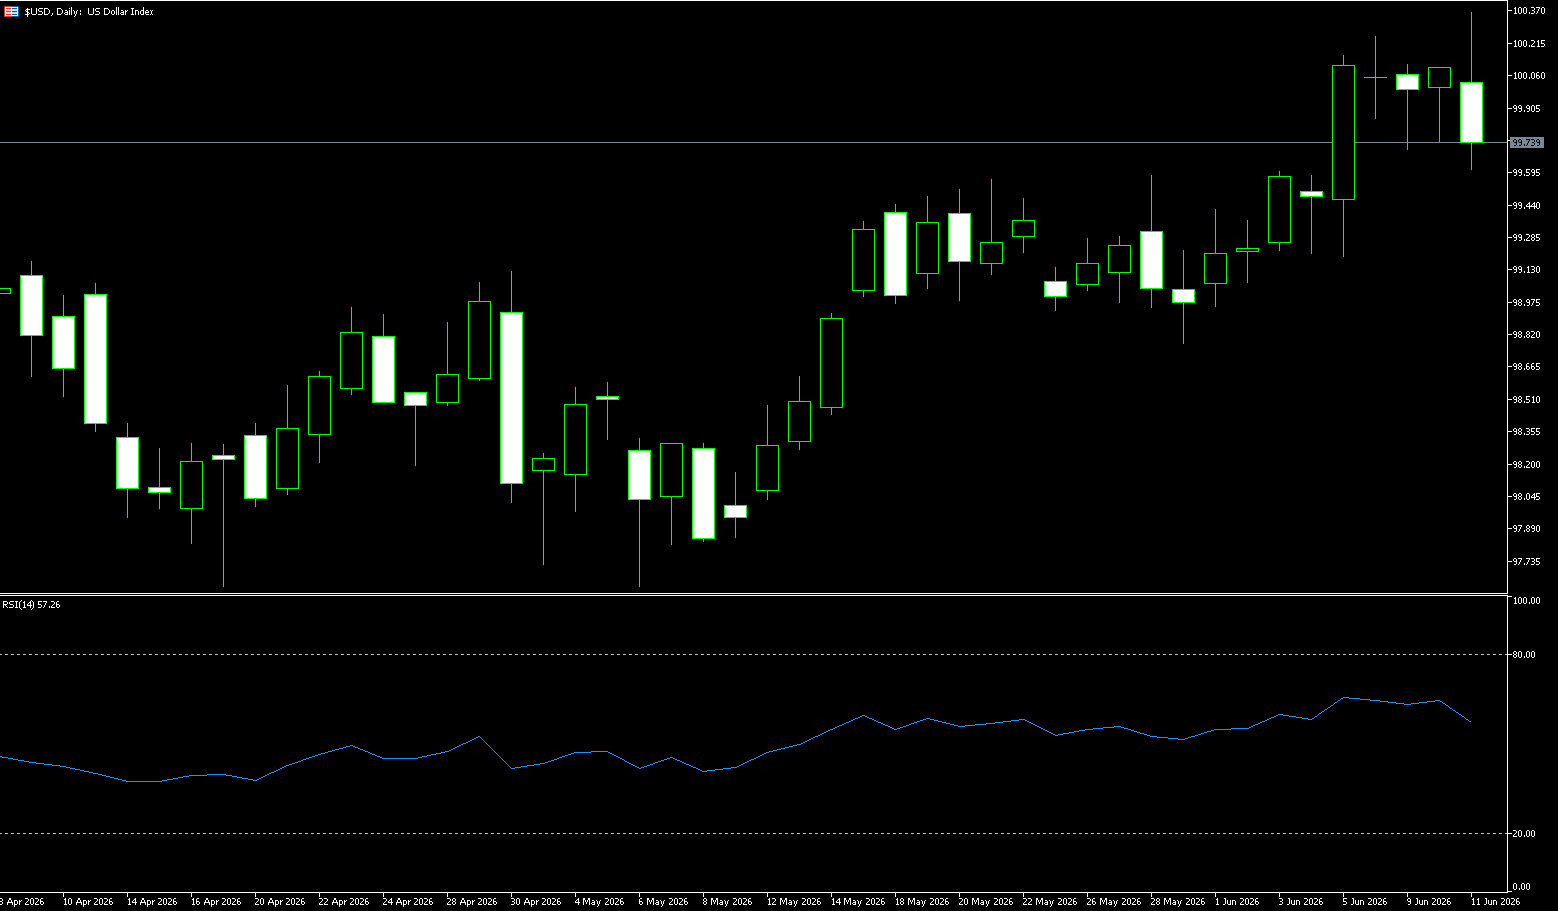
The US dollar index closed up 0.09% at 100.04 on Wednesday, having fallen as low as 99.71 during the session. This was due to the US May Consumer Price Index (CPI) rising 4.2% year-on-year, the largest increase in three years, but in line with market expectations and not significantly increasing the likelihood of a Fed rate hike this year. It fell to around 99.65 on Thursday. The lack of a widely feared acceleration in core inflation indicates that soaring energy prices have not yet transmitted to the Fed’s key indicators. Short-term US Treasury traders have reduced their bets on a September rate hike but remain confident that a rate hike before the end of October is inevitable. The situation in the Middle East deteriorated further on Wednesday, with the conflict spreading outwards from the Persian Gulf region. As a result, risk aversion spread rapidly, with funds accelerating their inflow into traditional safe-haven assets such as the US dollar, providing strong support for the US dollar index near the 100 level. If the conflict escalates further, the demand for the US dollar as a safe haven may continue to strengthen.
The US dollar index has recently shown a fluctuating upward trend on the daily chart, with prices recovering steadily from a recent low of 97.62 and currently trading around 99.90, approaching the previous high of 100.64. In terms of moving averages, the price has stabilized above the 20-day and 50-day moving averages, as well as the medium- and long-term moving averages, which are in a bullish alignment, providing support and maintaining the medium-term upward trend. Regarding indicators, the MACD DIFF line continues to run above the DEA line, with the red bars expanding, indicating continued bullish momentum; the RSI indicator has risen to around 61, not yet entering severely overbought territory, suggesting further upside potential. In summary, the US dollar index shows a clear short-term bullish trend, with key resistance at the 100.20-100.64 range. A decisive break above this level could lead to a challenge of the 101 mark. Support lies at 99.60 (this week’s low) and around the 20-day moving average (approximately 99.38), where a pullback is likely to find support. However, caution is advised regarding the risk of a technical correction due to overbought conditions.
Today, consider shorting the US dollar index at 99.80, with a stop-loss at 99.90 and targets at 99.40 and 99.30.
WTI Crude Oil
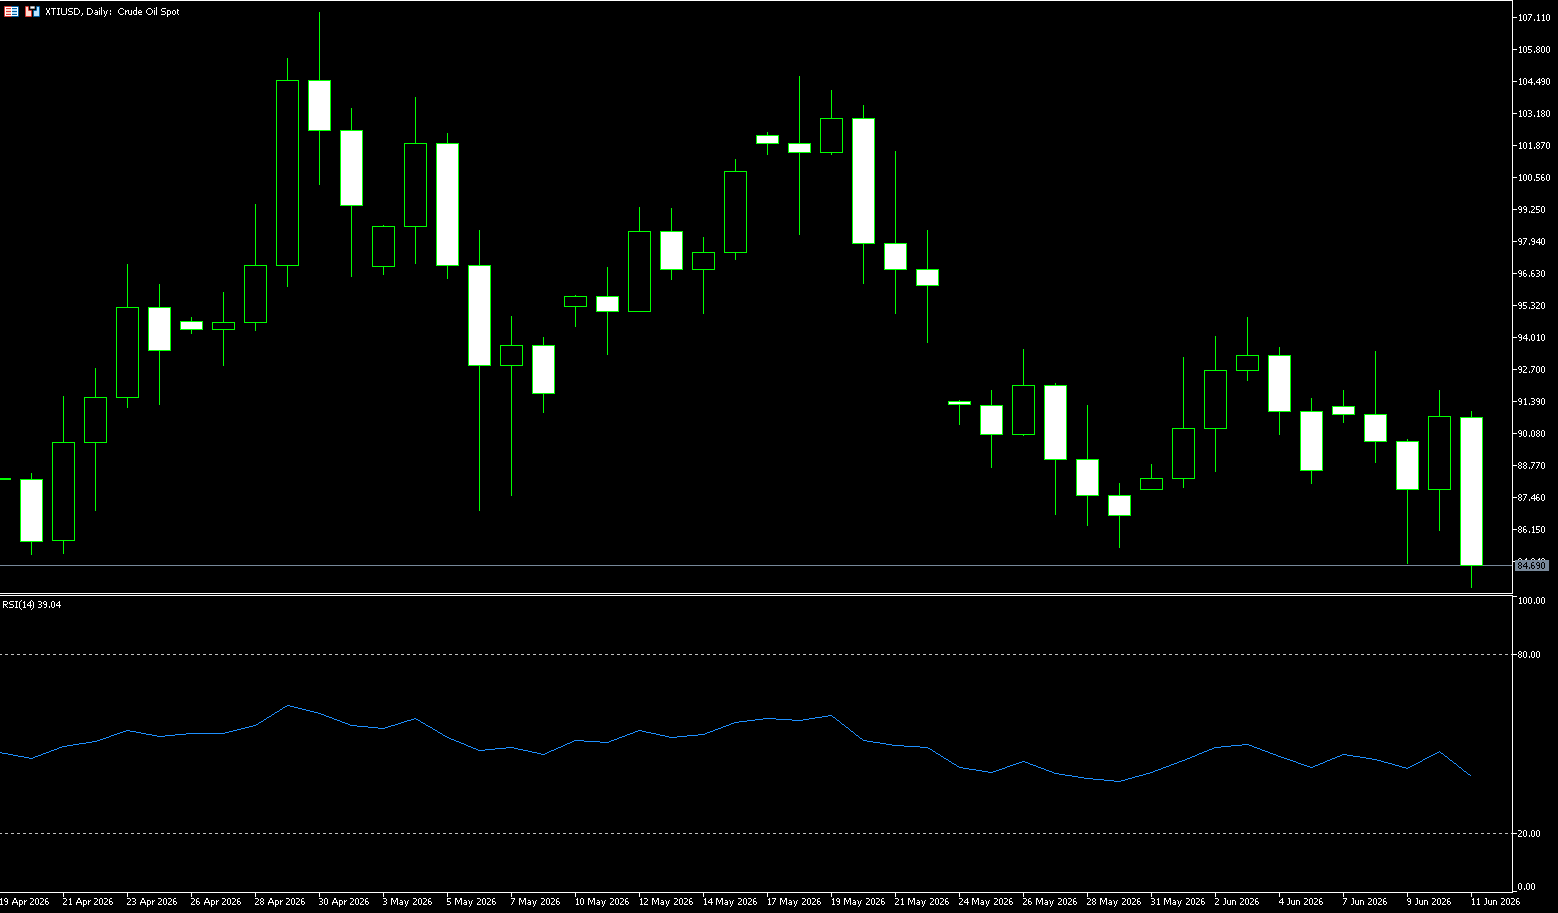
On Wednesday, Trump threatened a “fierce” attack on Iran if it failed to reach a peace agreement. Iran stated that the war would not be confined to the region, following the most serious exchange of fire between the two sides overnight since the ceasefire in April, exacerbating market concerns about supply disruptions. US crude oil surged more than 3% as a result, trading around $90.50 per barrel. This morning, WTI crude oil rose again to $92 before pulling back to stabilize around $85. However, Trump subsequently stated that the US military had secretly escorted over 100 million barrels of crude oil through the Strait of Hormuz, suggesting this would help curb oil prices, causing prices to give back some of their gains in late trading. Furthermore, data from the US Energy Information Administration (EIA) showed that US crude oil inventories fell by 7.2 million barrels in the week ending June 5, far exceeding analysts’ expectations of 4 million barrels, and strategic petroleum reserves fell to their lowest level since August 2023. At the same time, the US Department of Energy stated its plan to lend up to 40 million barrels of crude oil from the strategic petroleum reserve to businesses to help lower fuel prices.
From a trading perspective, if the agreement is finalized, global crude oil supply will increase, suppressing Brent and WTI oil prices; if negotiations break down, escalating geopolitical risks in the Middle East could push oil prices above $90/barrel and towards $100/barrel. Looking at the daily chart, the highs for US crude oil have successively shifted from $113.28/barrel and $107.00/barrel to $85.00/barrel, indicating a significant downward shift in the price center. The current price is below the Bollinger Band middle line at $92.83, indicating that the rebound has not yet changed the weak channel. On the MACD side, the DIFF is -2.02, the DEA is -1.55, and the histogram is -0.96, still below the zero line, representing insufficient momentum recovery. The recent low of $84.87/barrel and the lower Bollinger Band at $82.89/barrel form a market observation zone, while the Bollinger Band middle line at $92.83 and the vicinity of $94.92/barrel (the 34-day moving average) are important references for judging whether the risk premium can expand again. If the price cannot regain the middle line, the market is more like a pulse fluctuation driven by supply news than a trend revaluation.
Today, consider going long on crude oil at 85.00, with a stop loss at 84.80 and targets at 87.00 and 88.00.
Spot Gold
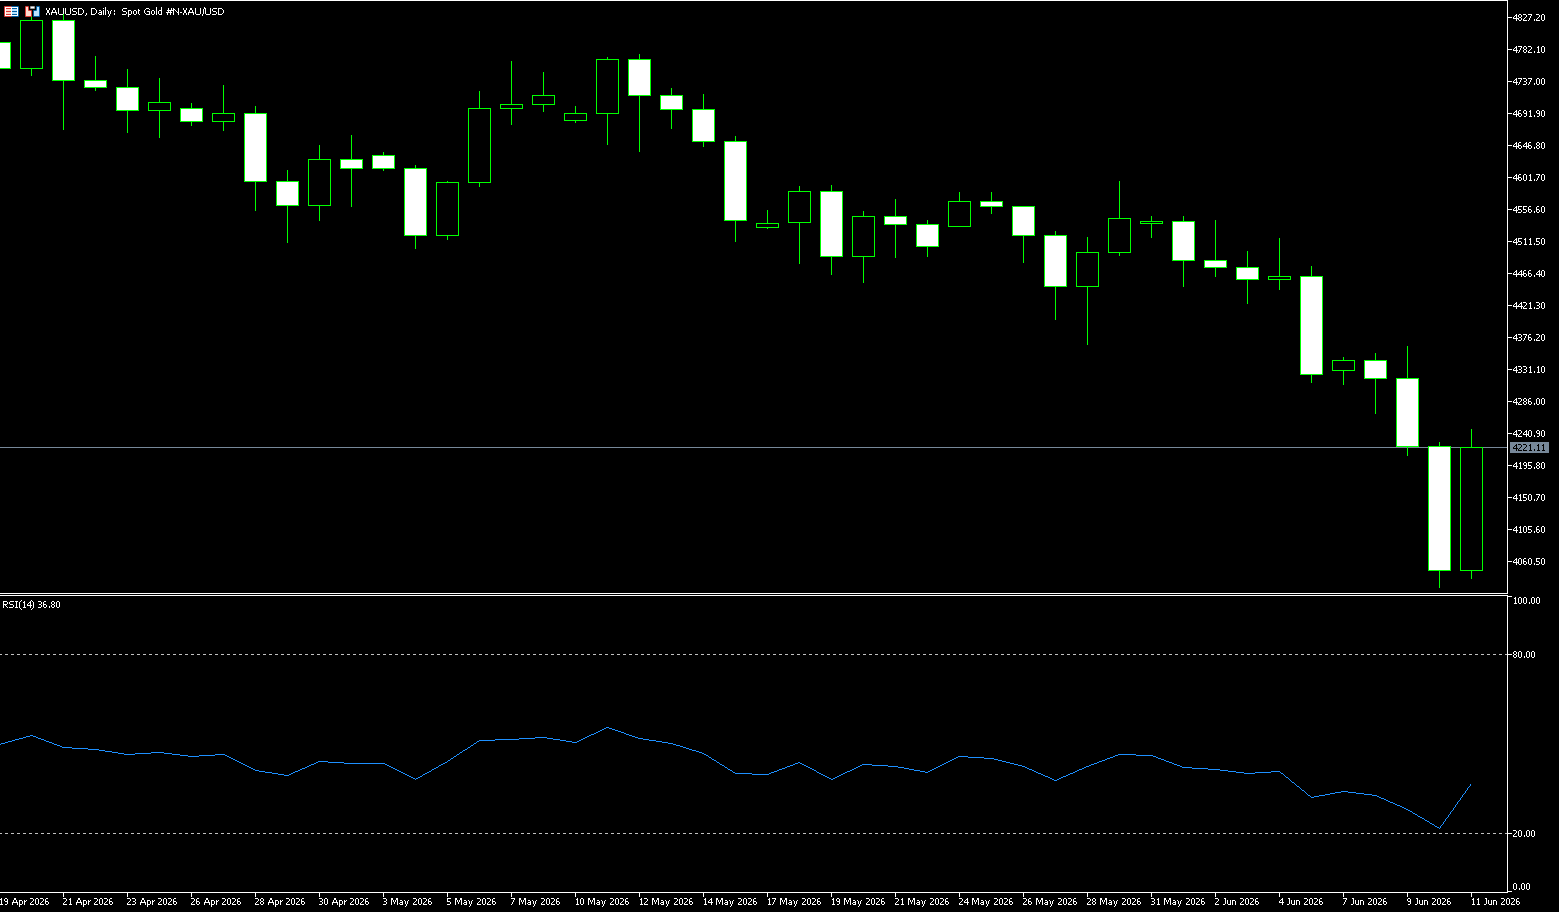
On Thursday (June 11th, Beijing time) in early Asian trading, spot gold continued its decline, hitting a seven-month low. It may test the $4000/ounce level during the day, benefiting from escalating tensions in the Middle East that have fueled market concerns about inflation and interest rate hikes. This followed US President Trump’s threat to launch a “fierce attack” on Iran if it fails to reach a peace agreement, while Iran retaliated with missile and drone attacks on US military bases in Jordan, Kuwait, and Bahrain. The CME Group’s FedWatch tool shows traders expect a 67% probability of a US interest rate hike in December. The US Labor Department’s May CPI data showed continued inflationary pressures, and the market is focused on Thursday’s PPI data for clues about monetary policy. Independent metals traders point out that strong non-farm payroll data and Trump’s threats have created a strong market demand for positive news. Despite recent consolidation in gold prices, analysts believe that central bank gold purchases and concerns about currency devaluation continue to support prices.
The USD/JPY exchange rate climbed to 160.38, further complicating the future trend of gold. Historically, yen depreciation has often been accompanied by a decline in gold prices—Japanese retail investors are the core holders of Asian gold ETFs, and when the yen depreciates, investors typically sell gold to hedge against the risk of domestic currency depreciation. Data shows that in the past 72 hours, selling pressure on gold has been concentrated at the two key levels of $4,250 and $4,300. Passive buying has been accumulating in the $4,070 to $4,100 range, and algorithmic market makers are prepared to absorb market selling pressure in this range. If gold prices decisively break below $4,070, the downside targets will be $4,000 (a psychological level) and $3,950 (the low point in February 2026), which was also the starting point for the previous rally to $4,350. In the short term, the more probable scenario is gold prices consolidating within the $4,000 to $4,250 range, with physical buying providing support at the lower limit and ETF selling pressure limiting any potential rebound.
Today, consider going long on gold at $4,205, with a stop-loss at $4,200 and targets at $4,250 and $4,270.
AUD/USD
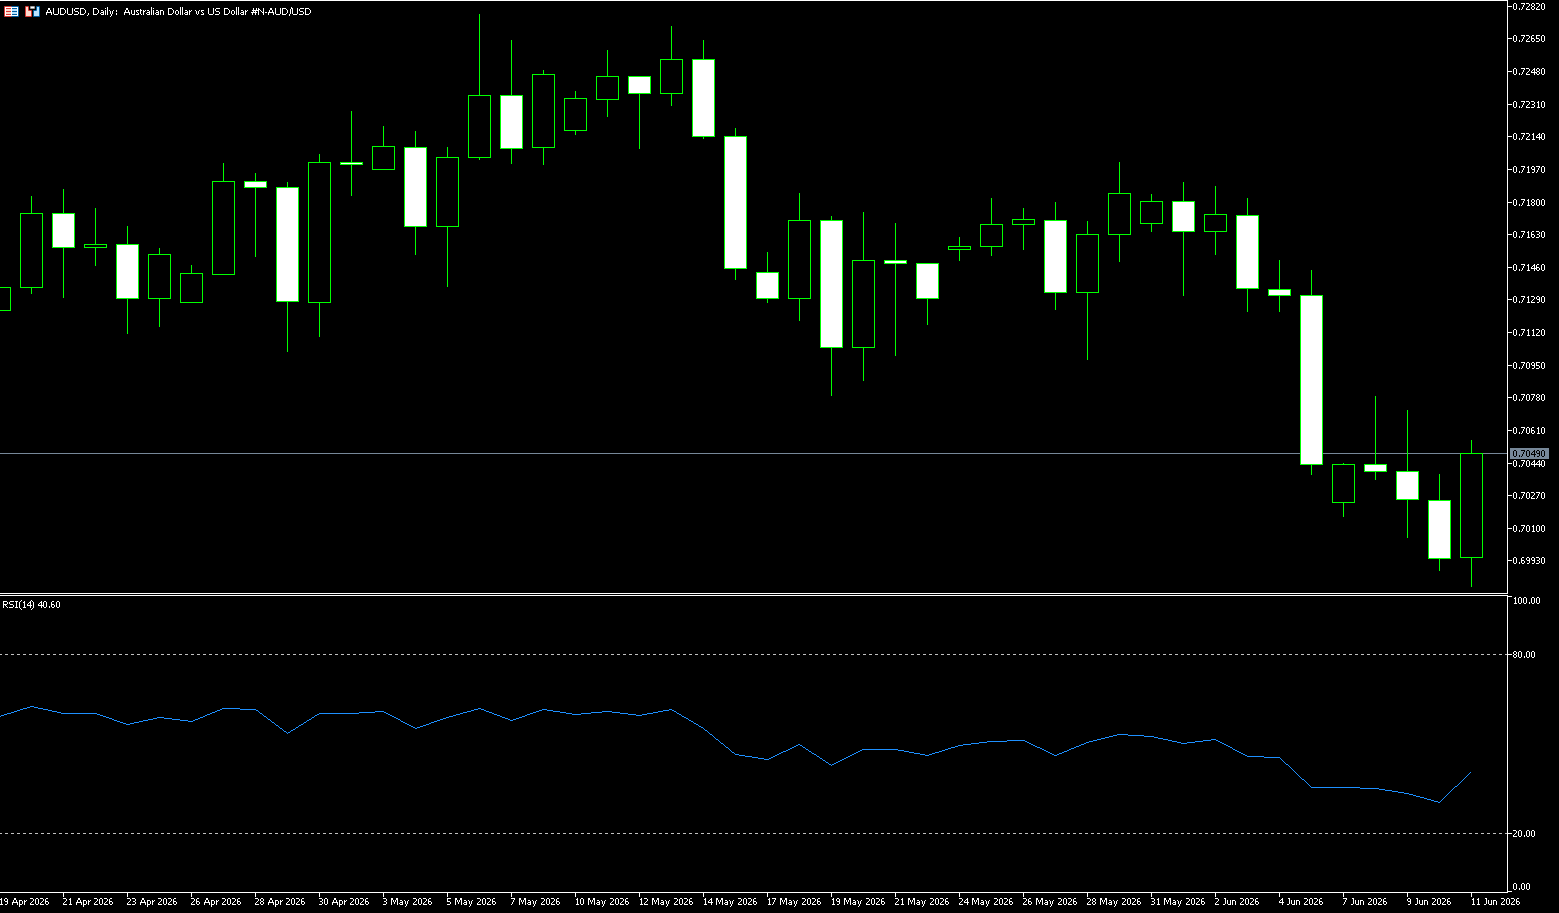
On Thursday, the Australian dollar maintained a downward trend against the US dollar, briefly falling below 0.70; it is currently trading around 0.7040. The exchange rate is currently being dragged down by two main factors: firstly, Trump’s threat of retaliation against Iran has escalated geopolitical tensions, driving funds towards safe-haven assets such as the US dollar; secondly, the market remains cautious ahead of Wednesday’s US CPI data release. Meanwhile, domestically in Australia, economists at the National Australia Bank withdrew their expectations for an August rate hike, believing the cash rate had peaked at 4.35%. The situation in the Middle East escalated sharply on June 9-10. Oil prices subsequently rebounded, with WTI crude oil rising to around $90 per barrel. The US dollar index maintained a high-level consolidation pattern. The escalating geopolitical risks caused funds to flow from risk-sensitive currencies like the Australian dollar to the US dollar, directly contributing to the pressure on the Australian dollar.
The Australian dollar against the US dollar is showing a pullback from its highs on the daily chart. The exchange rate has fallen rapidly from its recent high of 0.7270 and has now broken below the 20-day and 50-day moving averages, indicating a weak short-term trend. The moving average system shows that after breaking below the 20-day moving average, the price is testing the previous support level of 0.7000 (a psychological level). If this level is broken, further downside potential may open up. The MACD indicator shows that bearish momentum is still being released. The RSI indicator has fallen to around 34, approaching oversold territory, suggesting a potential technical rebound in the short term, but no clear stabilization signal has yet appeared. In summary, the Australian dollar is currently in a short-term consolidation phase against the US dollar. Resistance levels are around 0.7078 (this week’s high) and 0.7100 (the psychological level), where a rebound may encounter resistance. Key support lies at 0.6960 (the 140-day simple moving average), with strong support at the 0.6900 psychological level.
Today, consider going long on the Australian dollar at 0.7034, with a stop-loss at 0.7020 and targets at 0.7070 and 0.7080.
GBP/USD
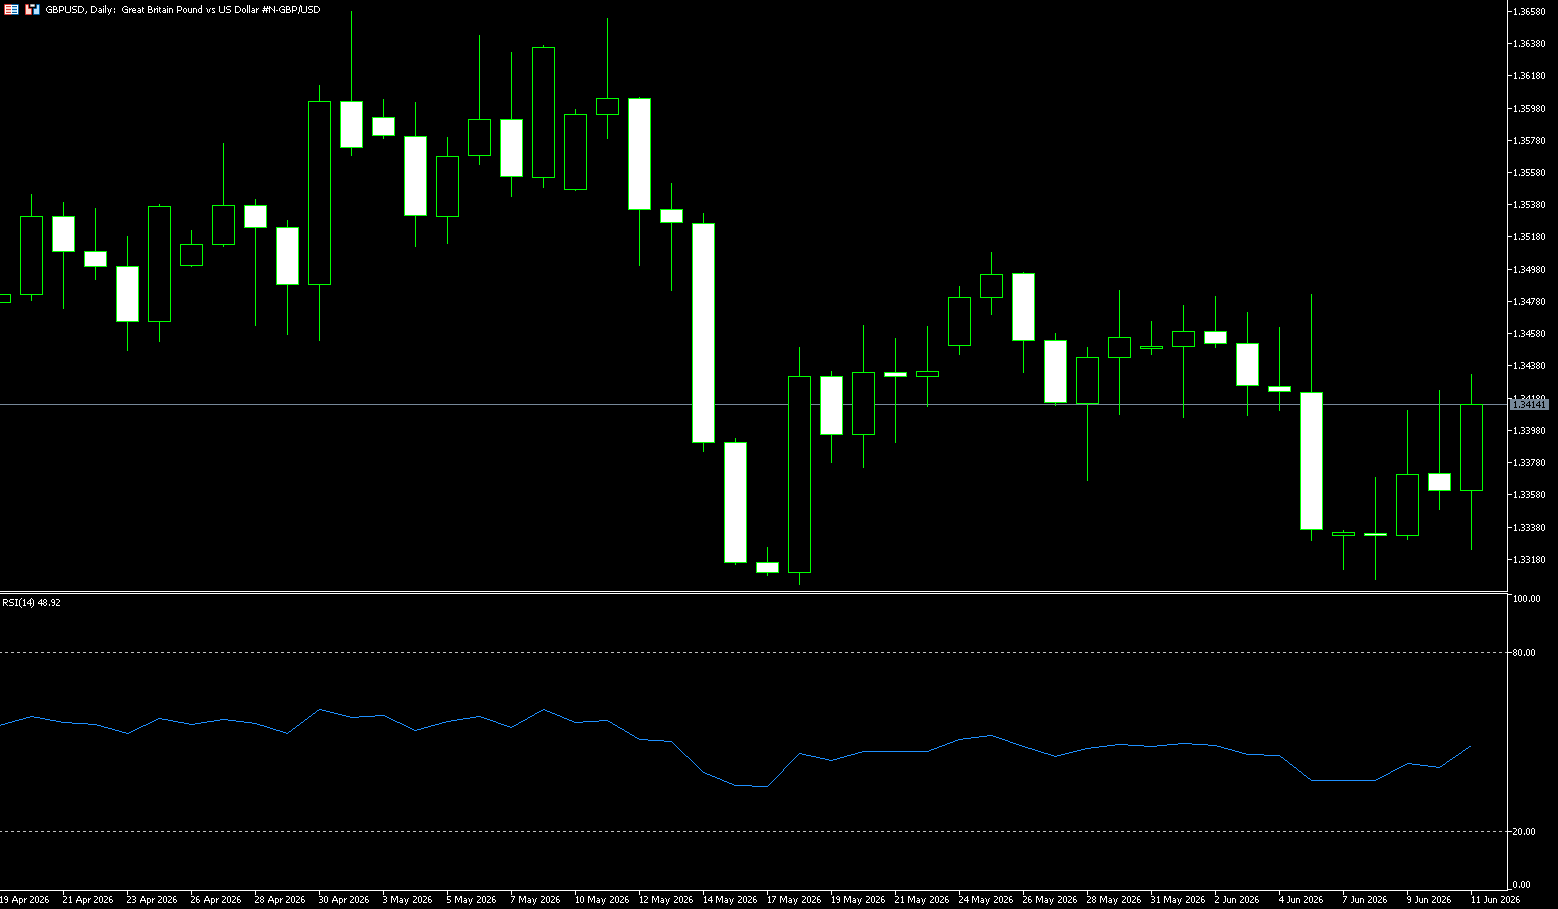
On Thursday, the pound traded in a consolidation phase against the dollar after rebounding from a three-week low for two consecutive days, fluctuating narrowly around 1.3400. Recent escalation of conflict in the Middle East has boosted safe-haven demand. The lack of significant progress in negotiations between the US and Iran has reduced market expectations for a stable peace agreement in the short term, supporting the dollar as a traditional safe-haven asset. In addition to geopolitical factors, concerns about the US inflation outlook also support the dollar’s performance. The Middle East situation has kept energy prices high, increasing market concerns about renewed inflation. If inflation data exceeds market expectations, it will further strengthen the possibility that the Federal Reserve will maintain high interest rates or even raise rates again, thus pushing the dollar higher and putting additional pressure on the pound against the dollar. In contrast, the pound’s own fundamentals are relatively complex. While the market expects the Bank of England to raise interest rates by at least 25 basis points by the end of 2026, which provides some support for the pound, uncertainty in the UK’s domestic political environment has weakened market interest in investing in the pound.
Currently, the pound’s movement against the dollar is influenced by the safe-haven demand for the dollar, expectations of Federal Reserve policy, and domestic factors in the UK. Escalating tensions in the Middle East and rising energy prices have heightened market concerns about persistent US inflation, providing support for the US dollar. While expectations of future interest rate hikes by the Bank of England have offered some assistance to the pound, political uncertainty has limited its rebound. From a technical perspective, the daily chart for GBP/USD shows that the pair rebounded from a three-week low but encountered significant resistance near the 1.3430 level (Thursday’s high), close to the key 200-day simple moving average at 1.3420, indicating continued selling pressure. A decisive break above the 1.3420-1.3430 area could lead to further resistance towards the 50.0% Fibonacci retracement level at 1.3476, with other resistance levels at the 61.8% retracement level at 1.3517. Continued resistance could lead to a retest of 1.3330 (Tuesday’s low), followed by the 1.3300 area (psychological level), or even lower support zones.
Today, consider going long on GBP/JPY at 1.3408, with a stop-loss at 1.3396 and targets at 1.3450 and 1.3460.
USD/JPY
On Thursday, news of Bank of Japan Governor Kazuo Ueda’s hospitalization became the focus of the market. Ueda is expected to receive treatment in the hospital for about two weeks and will miss the June 15-16 monetary policy meeting, which will be chaired by Deputy Governor Ryozo Himino, with Deputy Governor Shinichi Uchida handling the post-meeting press conference. This unexpected situation adds uncertainty to the upcoming interest rate decision and highlights the sensitivity of the current policy path. Despite the governor’s absence, the mainstream market view still expects the Bank of Japan to potentially raise the policy rate from 0.75% to 1.0%, a 31-year high. Continued pressure on energy prices due to the Middle East situation is pushing up inflation risks, and the Bank of Japan is increasingly concerned about the upside risks to prices. The Japanese government bond market initially weakened before stabilizing today. The 10-year yield touched 2.695%, and while the 30-year bond auction saw a widening gap at the end, the longer-term yields showed resilience, with futures prices recovering to around 128.77 at the close. This performance of Japanese bonds is directly linked to expectations of interest rate hikes, significantly impacting the yen exchange rate.
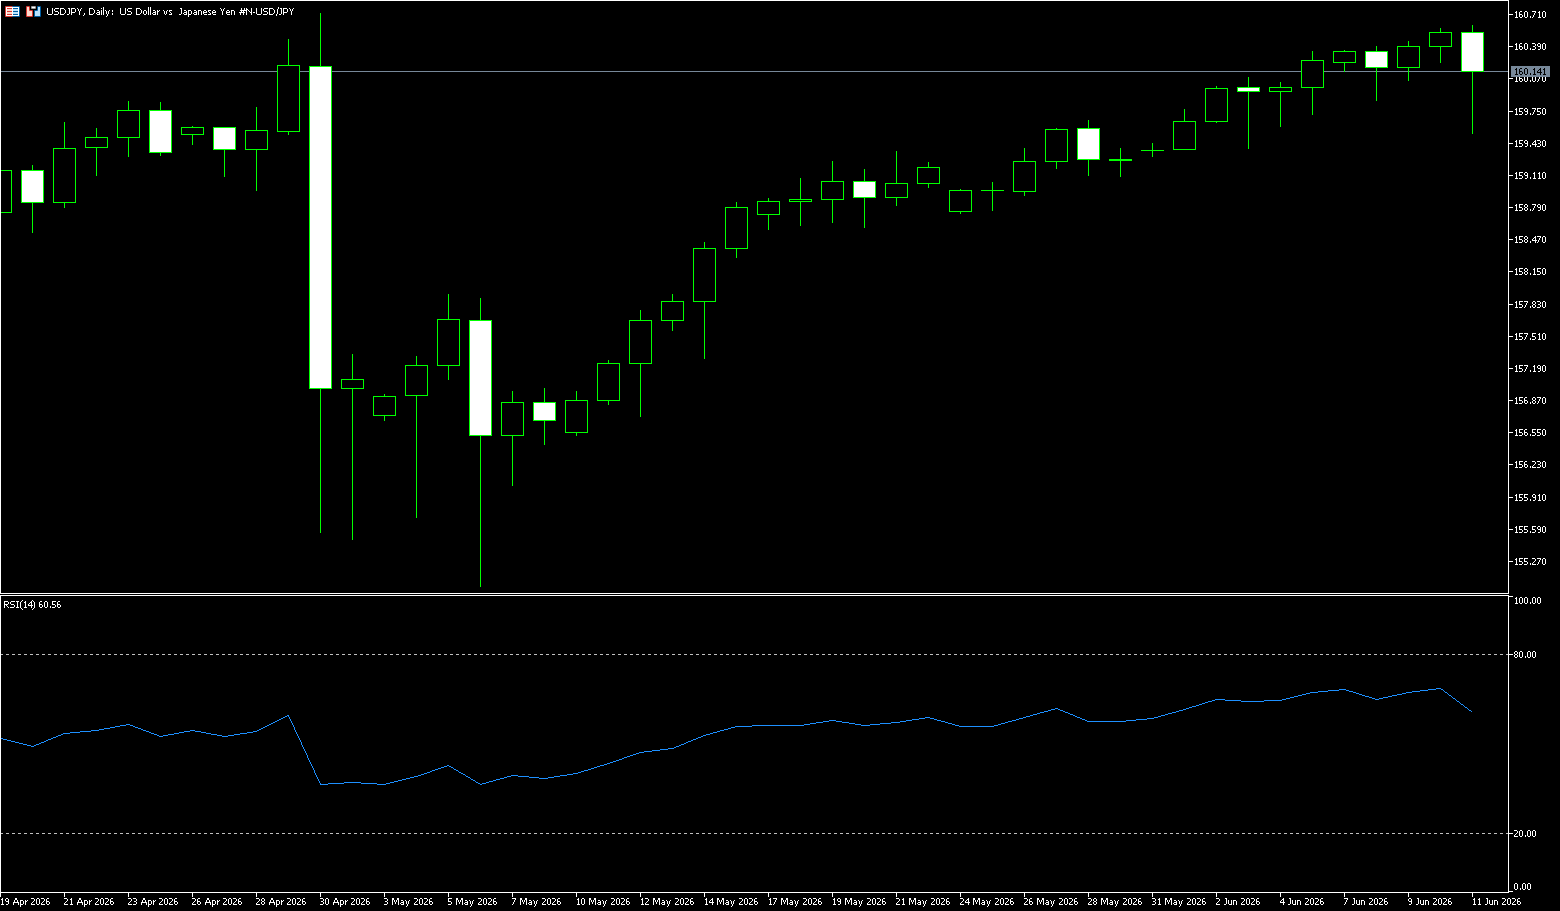
The fundamental logic chain is as follows: the absence of the governor increases variables → inflation risk dominates decision-making → the probability of interest rate hikes remains high → the central level of Japanese bond yields may rise → the yen’s financing and capital flow environment improves. This chain provides neutral to slightly positive support for the yen, but structural weakness still needs to be observed in tandem with the US dollar index. The 4-hour chart shows that the USD/JPY pair has rebounded from its mid-May low of 156.75, with a cumulative increase of over 370 points. The current price of 160.50 is in a consolidation phase at the high end of the bullish trend. The Bollinger Bands are: middle line at 159.57, upper band at 160.75, and lower band at 158.39. The price is biased towards the upper band, and there is potential for expansion after the bandwidth narrowed. The MACD indicator’s fast line is above the slow line, the histogram shows a slightly positive value, and a golden cross is emerging, indicating a recovery in bullish momentum, but with limited strength. The price action is mostly trading within the upper Bollinger Bands, reflecting a strong pattern. Key resistance levels for USD/JPY are 160.73 (April 30 high) and 161.00 (psychological level). A decisive break above these levels could open up further upside to 162.00. Key support levels are 160.00 (psychological level) and 159.57 (Bollinger Band midline). A break below the midline would test the lower band at 158.39.
Consider shorting USD at 160.08 today, with a stop-loss at 160.25 and targets at 159.30 and 159.20.
EUR/USD
The EUR/USD pair traded in a narrow range on Thursday, currently around 1.1580. A sudden escalation of geopolitical tensions led to a safe-haven flow back to the US dollar, causing the euro to retreat slightly against the dollar after two consecutive days of gains. US officials said on Wednesday that a second round of strikes against Iran was underway, targeting air defense and radar systems. This followed Washington’s retaliatory strikes against Iran on Tuesday, which it described as a “reciprocal response” to Iran’s downing of a US armed helicopter near the Strait of Hormuz the previous day. Signs of escalating US-Iran tensions could boost safe-haven demand for the dollar, thus putting downward pressure on the euro against the dollar in the short term. When geopolitical risks escalate, funds tend to flow into traditional safe-haven assets such as the dollar, making the euro a direct target of pressure. While the dollar is currently supported by both geopolitical tensions and rising US inflation expectations, the European Central Bank’s upcoming policy meeting on Thursday may provide some downside cushion for the euro.
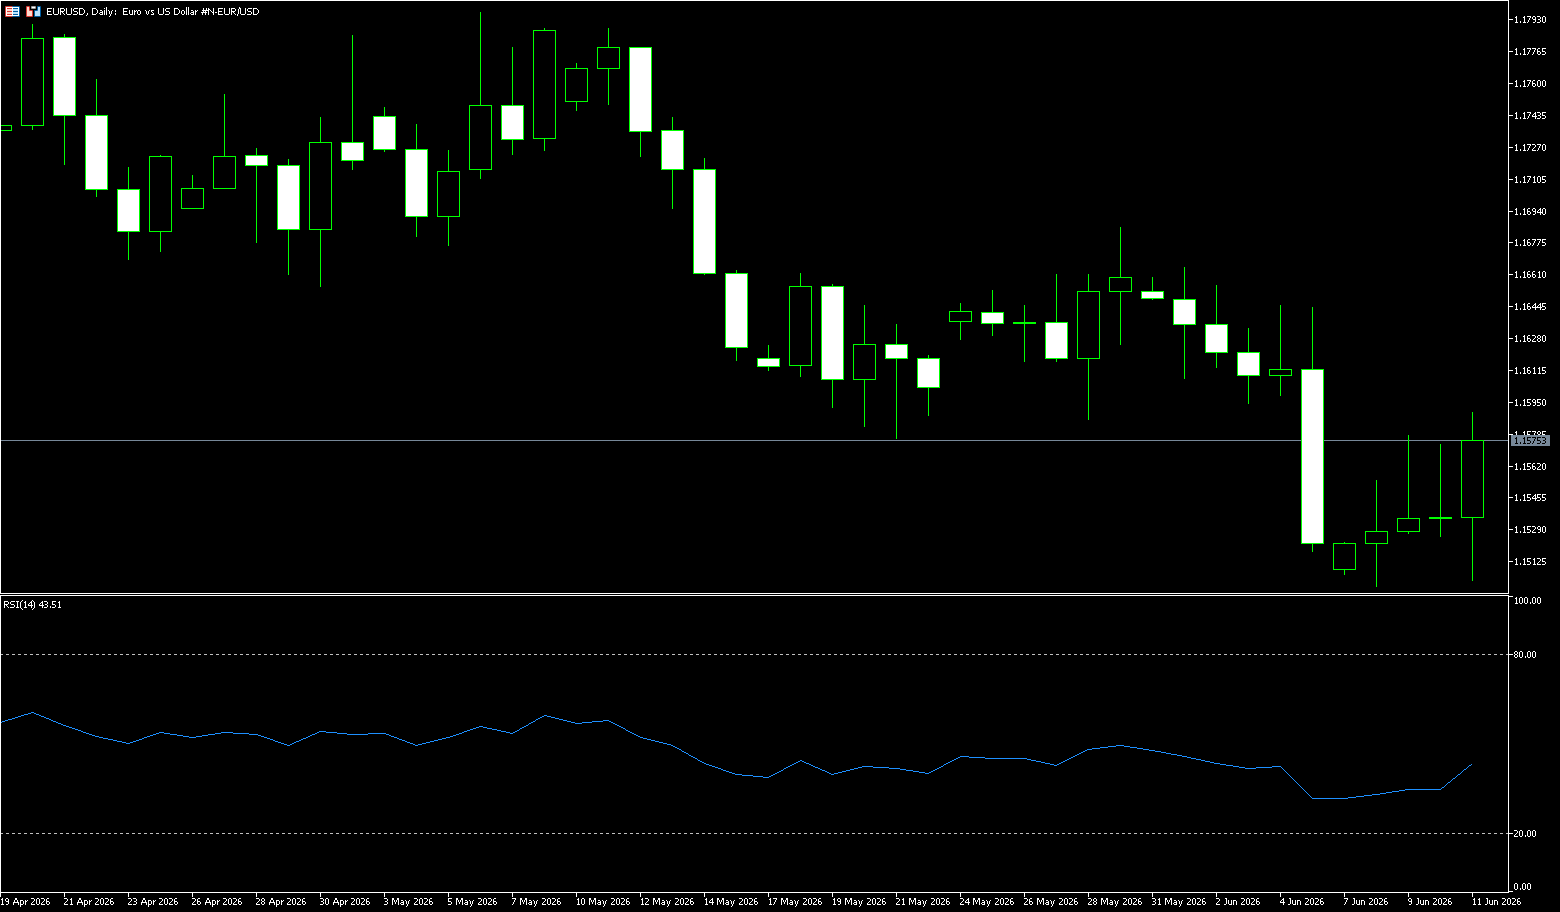
Currently, the euro/dollar exchange rate shows a weak short-term trend on the daily chart, with significant downward pressure. The exchange rate has currently broken below the 20-day, 50-day, and 100-day moving averages, and is testing the previous support level of 1.1499, only slightly above the historical low of 1.1410. Overall, it remains below the moving average system, confirming a short-term bearish trend. Resistance is seen at the psychological level of 1.1600 and the moving average and previous consolidation resistance around 1.1679. Support lies at 1.1499 and the previous low of 1.1410. In terms of indicators, the MACD’s DIFF and DEA are below the zero line, with the green bars continuing to expand, indicating ongoing bearish momentum. The RSI has fallen to 38.76, in the weak zone, approaching oversold territory but without a clear signal of stabilization or reversal. Overall, the exchange rate has shown weak rebound after breaking key support, with moving averages turning downwards and technical indicators remaining weak, suggesting a high probability of continued weak and volatile trading in the short term. If the support levels of 1.1499 and 1.1410 are broken, further downside potential will open up; if the resistance level of 1.1679 cannot be broken, the weak trend will be difficult to reverse.
Today, consider going long on the Euro at 1.1570, with a stop loss at 1.1560 and targets at 1.1620 and 1.1640.
Stock Analysis:
Australian ASX 200 Stock Index
Basic Market Overview:
The Australian Securities Exchange (ASX) 200 index fell 20 points, or 0.2%, to close at 8,633 on Thursday, reversing gains from the previous session, as weakness in the consumer durables, logistics, and financial sectors weighed on market sentiment. Concerns about a slowdown in the Australian economy intensified after Westpac reported that housing loan applications averaged 30,000 in the third fiscal quarter (starting in April), down from 33,000 in the previous quarter, highlighting the impact of global instability and domestic tax changes. Nevertheless, the earlier weakness eased as US stock index futures strengthened after Washington announced the end of its strikes against Iran. Traders are looking forward to next week’s Reserve Bank meeting, hoping for a pause in rate hikes after three increases this year. Meanwhile, consumer inflation expectations fell to 5.5% in June, the lowest level since March. Shares of the four major banks fell between 1.1% and 2.1%, with notably lagging companies including Sigma Healthcare (-2.9%), Goodman Group (-2.8%), South32 (-2.3%), and Northern Star Resources (-1.2%).
Sector Performance:
Leading Gains:
Consumer Staples +3.87%; Defensive demand improved, supermarket performance was strong; Woolworths (WOW) +3.2%, Coles (COL) +5%
Consumer Discretionary +3.58%; Retail stocks rebounded, market risk appetite fluctuated; Wesfarmers (WES) +3.5%, Harvey Norman (HVN) +3.5%
Leading Losers:
Materials -11%; Iron ore, gold, and lithium prices fell, concerns about Fed policy; BHP -1.9%, Rio Tinto -1.8%, Newmont -4.8%, Northern Star -4%
Gold Mining -4%; Gold prices fell to a six-month low; Evolution Mining -3.7%, Genesis Minerals -5%
Outstanding Stocks:
Steadfast Group (SDF): +36.2%, due to a $6.7 billion takeover offer from Amwins Group, a subsidiary of Dragoneer Investment, representing a 51.9% premium.
Tuas Ltd (TUA): +6.27% (today), with significant cumulative gains this week.
Technical Analysis:
The ASX200 traded in a slightly weaker range this week, fluctuating between 8,480 and 8,790. The short-term trend is bearish, but the medium-term structure remains intact. The key is to watch the breakout direction from the 8,480-8,500 support zone and the 8,780-8,810 resistance zone. Before a breakout, range trading is expected; after a breakout, follow the trend. This week saw significant market divergence, with defensive consumer stocks leading the gains, materials/mining sectors experiencing a deep correction, the energy sector performing strongly due to rising oil prices, and healthcare and telecommunications services also showing good performance. As of Thursday, June 11, the ASX200 fluctuated around 8,600 points, with a cumulative decline of about 0.5% this week. The RSI (14) is neutral to weak at 45-48, below the 50 midline, indicating slightly stronger selling pressure but not yet oversold. The MACD is near the zero line with a shrinking histogram, suggesting weakening bearish momentum but no golden cross yet. The ASX200 is currently in a short-term rebound phase within a medium-term downward trend. It has weakened for seven consecutive weeks since mid-April, but the decline has been characterized by a gradual bottoming process rather than a sharp drop, more in line with the characteristics of a corrective pullback than a new bear market.
Trading Strategies:
The following are technical trading ideas only and do not constitute investment advice. Leveraged trading may result in losses exceeding the principal.
Short-Term Strategies (1-5 days)
Long Positions:
Conservative Entry: If the index retraces to the strong support zone of 8,480-8,500 and shows signs of stabilization (e.g., hammer candlestick, bullish engulfing pattern), set a stop-loss below 8,450. Target 8,660 (200-day moving average), with a further target of 8,780-8,810 after a breakout.
Aggressive Entry: If the index breaks through and holds above 8,660 (200-day moving average), set a stop-loss at 8,620 and a target of 8,780.
Short Positions:
Conservative Entry: If the index rebounds to the strong resistance zone of 8,780-8,810 and encounters resistance and falls back (e.g., shooting star candlestick, bearish engulfing pattern), set a stop-loss above 8,830. Target 8,580, with a further target of 8,480 after a breakout. Point
Entry Point: The index broke below the key support level of 8,480 points with increased volume. Stop loss at 8,520 points, target 8,379 points.
Key Risk Warning:
If the index can hold the support level of 8,480-8,500 points and break through the resistance level of 8,780-8,810 points, the medium-term outlook will turn optimistic; conversely, if it breaks below the key support level, it may further decline to the 8,255-8,379 point range.
New Zealand 50 Index {NZX50}
Basic Market Overview:
The NZX50 index fell 51 points, or 0.4%, to close at 13,202 points on Thursday, ending a two-day rally and hitting its lowest level in two weeks, after reaching its highest point since May 7 the previous day. Broader indices followed Wall Street’s lackluster performance on Wednesday as escalating tensions in the Middle East pushed up oil prices. Concerns about U.S. inflation data for May also exerted pressure, as inflation accelerated to its highest level in three years, reinforcing market expectations that the Federal Reserve would keep interest rates unchanged. Investors remained cautious as they awaited Friday’s New Zealand May business PMI data, after the index recorded its lowest growth in seven months in April. Financial, materials, and industrial stocks were the main drags on the index, with significant declines seen in Infratil (-1.9%), Mainfreight (-1.8%), Ebos Group (-1.2%), Fletcher Building (-1.0%), and Westpac Banking Corp. (-0.9%).
Sector Performance:
Leading Gains:
Telecommunications Services: Relatively strong; Chorus +2.8%; Stable industry demand and good cost control.
Healthcare: Relatively strong; Fisher & Paykel Healthcare +1.0%; Export business benefited from the weakening New Zealand dollar, increasing overseas revenue.
Consumer Discretionary: Relatively strong; KMD Brands +9.3%; Private equity acquisition rumors drove a surge in share price.
Energy: Stabilized after volatility; Meridian Energy rose slightly as market expectations for electricity prices adjusted, showing strong performance on some trading days.
Key Highlights:
KMD Brands (consumer retail) performed the best, surging 9.3% on Wednesday due to reports that several private equity firms were interested in acquiring part or all of its business.
Fisher & Paykel Healthcare (medical devices), as an index weighted stock, performed relatively stably amid market volatility, supporting the healthcare sector.
Technical Analysis:
This week was generally characterized by consolidation and a tug-of-war between bulls and bears, without a clear one-sided trend. The medium-term upper limit is seen at 13310 as resistance, and the lower limit is… Support level at 13038. If the situation in the Middle East eases, Chinese data stabilizes, and expectations for a Fed rate cut increase, the NZX50 has a chance to challenge 13400; conversely, if the conflict worsens and inflation rebounds, the index will likely return to the range below 12900 and continue to fluctuate. Technical Indicators: RSI (14): 45.21, neutral range, no overbought or oversold conditions, balanced bullish and bearish forces, lacking unilateral momentum; MACD: the histogram remains slightly negative, bearish momentum is contracting but not fully turning bullish, and a golden cross has not yet formed; the volume and price structure shows increased volume on rebound days and decreased volume on decline days; significant divergence in weighting: medical leader FPH is resilient, while software and retail small-cap stocks have experienced huge declines this week (Vista -14%, Serko -11%, KMD -11%), with the top 10 weighted stocks accounting for 66.8% of the index, providing strong support for the index.
Trading Strategy (primarily short-term)
Long Strategy (after stabilizing at key support)
1. Entry Conditions: Index stabilizes above 13153 (50-day moving average), NZD/USD does not experience a significant drop, and there is no new escalation of conflict in the Middle East.
2. Entry Range: 13160–13200
3. First target: 13255; Second target: 13310
4. Hard stop loss: 13120 (A break below the 50-day moving average by 30 points confirms the support level has failed)
5. Position size: 5%-8% of total capital, reduce positions in batches, close half at 13255
Short-selling strategy (resistance and pullback)
1. Entry conditions: A pullback after reaching the 13280-13310 range, weakness in US stocks, and a sharp rise in oil prices pushing up inflation and interest rate hike expectations.
2. Entry range: 13280-13300
3. First target: 13200; Second target: 13153
4. Hard stop loss: 13340 (A break above the upper resistance level invalidates the bearish logic)
5. Position size: Equally light position size, do not engage in heavy bottom-fishing against the trend.
Risk warning: Middle East Conflict Recurrence: A renewed escalation of tensions between the US and Iran could lead to a surge in oil prices, global inflation concerns, and a delayed rate cut by the Reserve Bank of New Zealand, putting pressure on the stock market. Oil prices breaking $105 would significantly suppress NZX50 risk appetite.
China Economic Fluctuations: China is New Zealand’s largest trading partner; weak import/export and consumption data directly impact A2 milk, aviation, and logistics export-heavy stocks.
Disclaimer: The information contained herein (1) is proprietary to BCR and/or its content providers; (2) may not be copied or distributed; (3) is not warranted to be accurate, complete or timely; and, (4) does not constitute advice or a recommendation by BCR or its content providers in respect of the investment in financial instruments. Neither BCR or its content providers are responsible for any damages or losses arising from any use of this information. Past performance is no guarantee of future results.

Comments
No comments yet. Be the first to share your thoughts!
Comments only for logged-in users.